Download
1 / 28
300 likes | 523 Vues
Insulin Initiation and Intensification in the Type 2 Diabetic Patient. Jorge De Jesus MD FACE . Disclosures.

E N D
Insulin Initiation and Intensification in the Type 2 Diabetic Patient Jorge De Jesus MD FACE
Disclosures • Dr Jorge De Jesús has received honorariums as speaker for the following pharmaceutical companies: Bristol Myers-Squibb; Merck; Eli-Lilly; Astra-Zeneca; Boehringer- Ingelheim; Janssen • Dr Jorge De Jesús has no conflicts of interests with any entity for the information included in this presentation Jorge De Jesús MD FACE
What is -cell dysfunction? Major defect in individuals with type 2 diabetes Reduced ability of -cells to secrete insulin in response to hyperglycemia DeFronzo RA, et al. Diabetes Care 1992; 15:318–354.
Antihyperglycemic Monotherapy Maximum Therapeutic Effect on A1C, dependent upon starting A1C Baseline A1C 8.51 Acarbose Nateglinide 8.3-8.52 Sitagliptin Bromocriptine 7.73 7.8-12.54 Liraglutide 8.2-8.55 8.06 Exenatide 10.0-10.37 Pioglitazone 8.8-9.08 Repaglinide Glimepiride 7.79 Glipizide GITS 8.3-8.810 9.7-10.111 Metformin Insulin 0 -1.0 -1.5 -2.0 -0.5 Reduction in A1C Level (%) 1. Precose [PI]. West Haven, CT: Bayer; 2003; 2. Hanefeld M et al. Diabetes Care. 2000;23:202–207; 3. Sitagliptin PI, Merck & Co, Inc, Whitehouse Station, NJ, 2010;1-23; 4. Kerr et al. Ann Pharm. 2010;44:1777-1785; 5. Blonde et al. DiabObesMetab. 2009;11(S3):26-34; 6. Nelson P, et al. Diabetes TechnolTher. 2007;9:317–326; 7. Aronoff S, et al. Diabetes Care. 2000;23:1605–1611; 8. Lebovitz HE, et al. J ClinEndocrinolMetab. 2001;86:280–288; 9. Goldberg RB et al. Diabetes Care. 1996;19(8):849-856; 10. Simonson DC et al. Diabetes Care. 1997;20(4):597-606; 11. Garber AJ, et al. Am J Med. 1997;102:491–497.
Insulin • Remains the most powerful tool we have to control blood glucose • Dosing potential and A1C reduction only limited by risk of hypoglycemia • Patients with type 2 diabetes are at lower risk for hypoglycemia than type 1 patients Nathan DM, et al. Diabetes Care. 2006;29:1963-1972.
When To Start Insulin in T2DM • When combination oral/injectable agents become inadequate • Have poor AM or daytime glycemic control • Unacceptable side effects of oral/injectable agents • Patient wants more flexibility • Special circumstances (i.e. steroids, infection, pregnancy) • Patients with hepatic or renal disease
Normal Insulin Secretion 75 Bolus or Meal Response Dawn Phenomenon Basal or Background 50 Plasma Insulin (U/mL) Decrease at Night 25 0 4:00 8:00 12:00 16:00 20:00 24:00 4:00 8:00 Time (hrs) Polonsky W. Diabetes Educ. 2007;33(suppl 3):241S–244S.
Treat to Target StudyInsulin Glargine vs. NPH Insulin Added to Oral Therapy • 9 Insulin glargine NPH insulin • 8 Mean A1C(%) • 7 Target A1C (%) 60% reach target A1C < 7% • 6 • 0 • 4 • 8 • 12 • 16 • 20 • 24 Weeks Riddle MC, et al. Diabetes. 2002;51(suppl 2):A113.
Treat to Target Study: Cumulative Incidence of Hypoglycemia (N=756) PG 72 mg/dL ( 4.0 mmol/L) NPH insulin Insulin glargine Insulin Glargine vs. NPH in Overweight Patients with T2DM Cumulative Hypoglycemic Events NPH, Neutral protamineHagedorn; PG, plasma glucose. Riddle MC, et al. Diabetes Care. 2003;26:3080-3086.
Detemir + OAD NPH + OAD Risk of Hypoglycemia with Detemir p < 0.001 18 16 14 12 Hypoglycemic events per patient per year 10 8 p < 0.001 6 4 2 0 Overall Nocturnal* * Any episode between 11 pm and 6 am Please see full prescribing information. Insulin detemir [package insert]. Bagsvaerd, Denmark; Novo Nordisk; 2009. NPH insulin [package insert]. Bagsvaerd, Denmark; Novo Nordisk; 2009. Hermansen K et al. Diabetes Care. 2006;29:1269-1274.
Insulin Detemir vs. NPH Weight Profile 3 Insulin detemir *p<0.05, insulin detemir vs NPH insulin NPH insulin 2.5 2 * * * * * * * * * * * * 1.5 1 Weight change (kg) 0.5 0 Studies in type 2 diabetes -0.5 -1 Hermansen Standl Vague De Leeuw Pieber Pieber Home Home Russell-Jones Hermansen Rašlová Haak
Long-acting insulin analogs are superior to NPH insulin because they provide a fairly flat response for approximately 24 hours and pro-vide better reproducibility and consistency both between subjects and within subjects, with a corresponding reduction in the risk of hypoglycemia. • Rapid-acting insulin analogs are superior to Regular because they are more predictable.
24-Hour Insulin Secretion and Replacement Aspart Lispro Glulisine Regular 50 Insulin (µU/mL) 25 Total Daily Dose (TDD) ~50% Bolus Insulin ~50% Basal Insulin 0 Breakfast Lunch Dinner Detemir Glargine NPH Riddle MC et al. The American Journal of Medicine. 2005;118(5A):14S–20S. Tanaka M. et al. The Journal of International Medical Research. 2010;38:674–68.
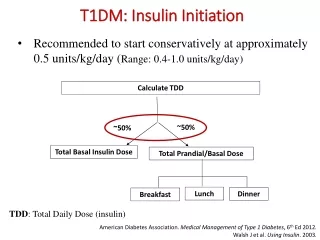
Example: Starting Multiple Daily Injections in 100-kg Person with Moderate Insulin Resistance • Starting dose = 0.5 x wt in kg • 0.5 x 100 kg = 50 units • Basal dose = 50% of starting dose at bedtime • 50% of 50 units = 25 units at bedtime • Total bolus dose = 50% of starting dose evenly distributed1/3 at each meal • 25 units ÷ by 3 meals = 8 units before meals (TID)
Meal Insulin Rapid-Acting Analogs (Lispro, Aspart, Glulisine) vs Regular Timing of food absorbed Analog insulin 10 8 6 Insulin Activity 4 Regular Human Insulin 2 0 1 2 3 4 5 6 7 8 9 10 11 12 0 Hours Howey DC, et al. Diabetes. 1994;43:396–402.
Barriers to insulin initiation Patients refusal Insulin costs Fear of Hypoglycemia Myths Medical Inertia Patient education is time consuming Sometimes we transmit our concerns to patients even with non-verbal communication
Es mejorprenderunavelitaquemaldecir la oscuridad Gracias Agradecer al Dr Harry Jimemnez por la ayuda en algunos visuales de esta presentacion