Download
1 / 6
510 likes | 3.19k Vues
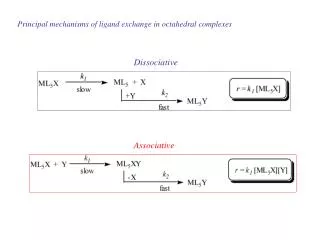
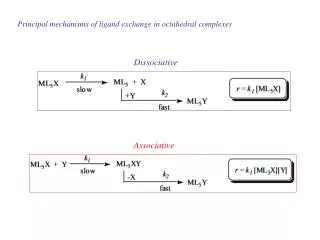
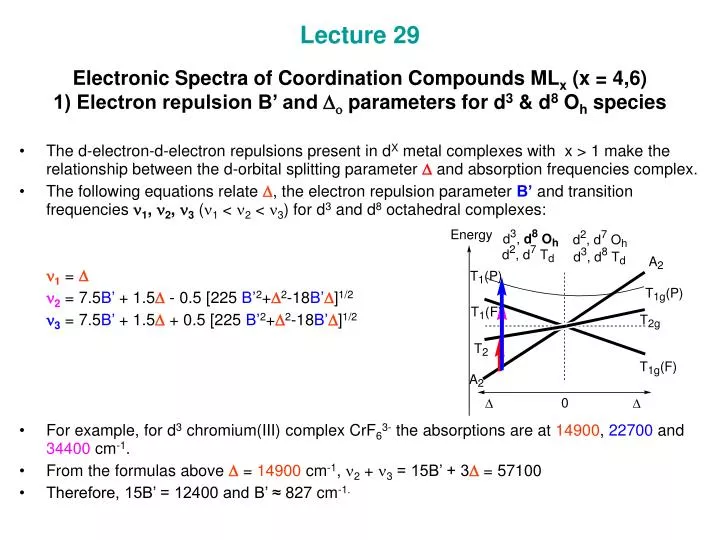
Lecture 29 Electronic Spectra of Coordination Compounds ML x (x = 4,6) 1) Electron repulsion B’ and D o parameters for d 3 & d 8 O h species.

E N D
Lecture 29Electronic Spectra of Coordination Compounds MLx (x = 4,6) 1) Electron repulsion B’ and Do parameters for d3 & d8 Oh species • The d-electron-d-electron repulsions present in dX metal complexes with x > 1 make the relationship between the d-orbital splitting parameter D and absorption frequencies complex. • The following equations relate D, the electron repulsion parameter B’ and transition frequencies n1, n2, n3 (n1 < n2 < n3) for d3 and d8 octahedral complexes: n1 = D n2 = 7.5B’ + 1.5D - 0.5 [225 B’2+D2-18B’D]1/2 n3 = 7.5B’ + 1.5D + 0.5 [225 B’2+D2-18B’D]1/2 • For example, for d3 chromium(III) complex CrF63- the absorptions are at 14900, 22700 and 34400 cm-1. • From the formulas above D = 14900 cm-1, n2 + n3 = 15B’ + 3D = 57100 • Therefore, 15B’ = 12400 and B’ ≈ 827 cm-1.
2) Tanabe-Sugano diagrams. d2 octahedral complexes • Tanabe-Sugano diagrams have been calculated for the cases of all ligand field strengths for all octahedral dn-metal complex configurations. • The diagrams allow for estimation of a complete set of parameters included in the calculations: i) the (apparent) electron repulsion parameter B’, ii) D, iii) transition frequencies. • To calculate these parameters we need to have at least two experimentally found transition frequencies. • Consider an example of a d2 metal complex and the appropriate Tanabe-Sugano diagram. • From 3 bands expected for V(H2O)63+(d2) in its UV spectrum we have one at n1 =17200 (3T1g(F) 3T2g)and another at n2 = 25700 (3T1g(F) 3T1g(P)) cm-1. The third expected transition n3(3T1g(F) 3A2g)is far in the UV region and is masked by other absorptions. We can calculate the n3. • For n2/n1 = 1.49 on diagram we find n1/B ≈ 25; n2/B= 37; n3 / B = 52; D/(10B) = 2.7. Then B ≈ 691cm-1; D = 18660 cm-1; n3≈ 35930 cm-1.
3) Terms of d5 metal complexes • Terms of freed5 metal ions are 6S, 4G, 4F, 4D, 4P, 2I, 2H, 2G, 2G, 2F, 2F, 2D, 2D, 2D, 2P, 2S (16 terms, 252 microstates). The lowest energy term is 6S. • In the octahedral ligand field the 6S term will NOT be split. It gives rise to a single 6A1g term. • The 6A1g term is the ground state term at weak ligand fields. NO terms of the same multiplicity exists and thus NOspin-allowed e-e transition is possible. • At strong ligand fields spin pairing occurs (t23e2 t25). As a result, the ground state term and the multiplicity change from 6A1gto 2T2g(I).
4) Weak ligand fields, all dn configurations: the number and intensity of bands • The number of the spin-allowed electronic transitions for all dn metal configurations for the case of weak ligand fields is given in table below. • The intensity of absorption bands can be evaluated on the basis of the selection rules. The symmetry forbidden d-d transitions for d1-d4, d6-d9 complexes below have e in the range of 1 – 103 L/(mol cm). Both symmetry and spin forbidden transitions for d5 complexes have e of 0.001 – 1 L/(mol cm).
5) Line width in electronic spectra A regular absorption band in electronic spectra is of several thousands cm-1 wide. The width is associated with: a) combination of vibrational and electronic (vibronic) transitions; b) distortion of the complex geometry (ligands shift) with or without change of initial symmetry. The related change of D and/or term splitting pattern affect the position of the “immediate” absorption maximum. In rare cases bands are as narrow as of few hundreds of cm-1. This is the case when the energy gap between the ground and excited states is not a function of D.
6) Line width in electronic spectra • Terms which are not affected by metal complex vibrations appear as horizontal lines on Tanabe-Sugano diagrams. • For high-spin d5 complexes these are in particular the terms 4A1g, 4Eg(G). The electronic transitions to these levels produce narrow absorption lines. • Narrow lines corresponding to these transitions can be seen in a spectrum of d5 high spin MnF2 (MnII ion has an octahedral environment in the crystal lattice): 4A1g(G) 4Eg(G) 4T1g(G) 4T2g(G)