Download
1 / 1
10 likes | 155 Vues
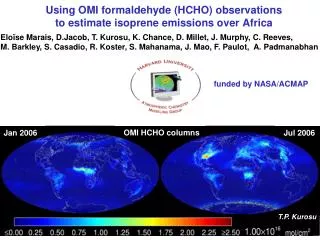
Using OMI HCHO observations as a constraint on isoprene emissions over Africa Eloïse Marais (emarais@fas.harvard.edu) 1 , Daniel Jacob 1 , Jennifer Murphy 2 , Dylan Millet 3 , Thomas Kurosu 4 , Kelly Chance 4

E N D
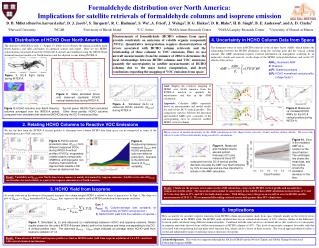
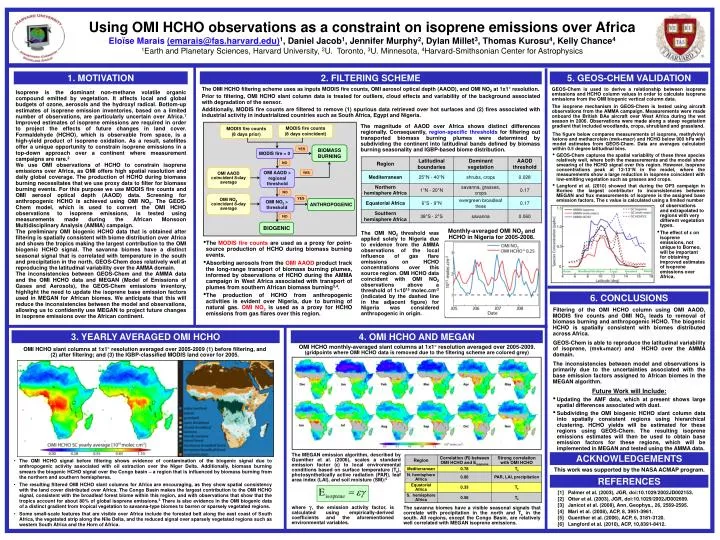
Using OMI HCHO observations as a constraint on isoprene emissions over Africa Eloïse Marais (emarais@fas.harvard.edu)1, Daniel Jacob1, Jennifer Murphy2, Dylan Millet3, Thomas Kurosu4, Kelly Chance4 1Earth and Planetary Sciences, Harvard University, 2U. Toronto, 3U. Minnesota, 4Harvard-Smithsonian Center for Astrophysics 1. MOTIVATION 2. FILTERING SCHEME 5. GEOS-CHEM VALIDATION The OMI HCHO filtering scheme uses as inputs MODIS fire counts, OMI aerosol optical depth (AAOD), and OMI NO2 at 1x1° resolution. Prior to filtering, OMI HCHO slant column data is treated for outliers, cloud effects and variability of the background associated with degradation of the sensor. Additionally, MODIS fire counts are filtered to remove (1) spurious data retrieved over hot surfaces and (2) fires associated with industrial activity in industrialized countries such as South Africa, Egypt and Nigeria. GEOS-Chem is used to derive a relationship between isoprene emissions and HCHO column values in order to calculate isoprene emissions from the OMI biogenic vertical column data. Isoprene is the dominant non-methane volatile organic compound emitted by vegetation. It affects local and global budgets of ozone, aerosols and the hydroxyl radical. Bottom-up estimates of isoprene emission inventories, based on a limited number of observations, are particularly uncertain over Africa.1 Improved estimates of isoprene emissions are required in order to project the effects of future changes in land cover. Formaldehyde (HCHO), which is observable from space, is a high-yield product of isoprene oxidation. As a result, satellites offer a unique opportunity to constrain isoprene emissions in a top-down approach over a continent where measurement campaigns are rare.2 We use OMI observations of HCHO to constrain isoprene emissions over Africa, as OMI offers high spatial resolution and daily global coverage. The production of HCHO during biomass burning necessitates that we use proxy data to filter for biomass burning events. For this purpose we use MODIS fire counts and OMI aerosol optical depth (AAOD) data. Screening for anthropogenic HCHO is achieved using OMI NO2. The GEOS-Chem model, which is used to convert the OMI HCHO observations to isoprene emissions, is tested using measurements made during the African Monsoon Multidisciplinary Analysis (AMMA) campaign. The preliminary OMI biogenic HCHO data that is obtained after filtering is spatially consistent with biome distribution over Africa and shows the tropics making the largest contribution to the OMI biogenic HCHO signal. The savanna biomes have a distinct seasonal signal that is correlated with temperature in the south and precipitation in the north. GEOS-Chem does relatively well at reproducing the latitudinal variability over the AMMA domain. The inconsistencies between GEOS-Chem and the AMMA data and the OMI HCHO data and MEGAN (Model of Emissions of Gases and Aerosols), the GEOS-Chem emissions inventory, highlight the need to update the isoprene base emission factors used in MEGAN for African biomes. We anticipate that this will reduce the inconsistencies between the model and observations, allowing us to confidently use MEGAN to project future changes in isoprene emissions over the African continent. The isoprene mechanism in GEOS-Chem is tested using aircraft observations from the AMMA campaign. Measurements were made onboard the British BAe aircraft over West Africa during the wet season in 2006. Observations were made along a steep vegetation gradient that included woodlands, crops, shrubland and grassland. The magnitude of AAOD over Africa shows distinct differences regionally. Consequently, region-specific thresholds for filtering out transported biomass burning plumes were determined by subdividing the continent into latitudinal bands defined by biomass burning seasonality and IGBP-based biome distribution. MODIS fire counts (8 days coincident) MODIS fire counts (8 days prior) • The figure below compares measurements of isoprene, methylvinylketone and methacrolein (mvk+macr) and HCHO below 900 hPa with model estimates from GEOS-Chem. Data are averages calculated within 0.5 degree latitudinal bins. • GEOS-Chem captures the spatial variability of these three species relatively well, where both the measurements and the model show smearing of the HCHO signal over this region. However, isoprene concentrations peak at 12-13°N in the model, where the measurements show a large reduction in isoprene coincident with low-emitting vegetation such as grasses and crops. • Langford et al. (2010) showed that during the OP3 campaign in Borneo the largest contributor to inconsistencies between MEGAN and flux measurements of isoprene is the assigned base emission factors. The ε value is calculated using a limited number BIOMASS BURNING YES MODIS fire > 0 NO OMI AAOD coincident 8-day average OMI AAOD > regional threshold YES NO OMI NO2 coincident 8-day average YES OMI NO2 > threshold ANTHROPOGENIC • of observations and extrapolated to regions with very different vegetation types. • The effect of ε on isoprene emissions, not unique to Borneo, will be important for obtaining improved estimates of isoprene emissions over Africa. NO BIOGENIC Monthly-averaged OMI NO2 and HCHO in Nigeria for 2005-2008. The OMI NO2 threshold was applied solely to Nigeria due to evidence from the AMMA observations of the local influence of gas flare emissions on HCHO concentrations over this source region. OMI HCHO data coincident with OMI NO2 observations above a threshold of 11015 molec.cm-2 (indicated by the dashed line in the adjacent figure) for Nigeria was considered anthropogenic in origin. • The MODIS fire counts are used as a proxy for point-source production of HCHO during biomass burning events. • Absorbing aerosols from the OMI AAOD product track the long-range transport of biomass burning plumes, informed by observations of HCHO during the AMMA campaign in West Africa associated with transport of plumes from southern African biomass burning3,4. • The production of HCHO from anthropogenic activities is evident over Nigeria, due to burning of natural gas. OMI NO2is used as a proxy for HCHO emissions from gas flares over this region. 6. CONCLUSIONS • Filtering of the OMI HCHO column using OMI AAOD, MODIS fire counts and OMI NO2 leads to removal of biomass burning and anthropogenic HCHO. The biogenic HCHO is spatially consistent with biomes distributed across Africa. • GEOS-Chem is able to reproduce the latitudinal variability of isoprene, (mvk+macr) and HCHO over the AMMA domain. • The inconsistencies between model and observations is primarily due to the uncertainties associated with the base emission factors assigned to African biomes in the MEGAN algorithm. • Future Work will Include: • Updating the AMF data, which at present shows large spatial differences associated with dust. • Subdividing the OMI biogenic HCHO slant column data into spatially consistent regions using hierarchical clustering. HCHO yields will be estimated for these regions using GEOS-Chem. The resulting isoprene emissions estimates will then be used to obtain base emission factors for these regions, which will be implemented in MEGAN and tested using the AMMA data. 3. YEARLY AVERAGED OMI HCHO 4. OMI HCHO AND MEGAN OMI HCHO monthly-averaged slant columns at 1x1° resolution averaged over 2005-2009. (gridpoints where OMI HCHO data is removed due to the filtering scheme are colored grey) OMI HCHO slant columns at 1x1° resolution averaged over 2005-2009 (1) before filtering, and (2) after filtering; and (3) the IGBP-classified MODIS land cover for 2005. The MEGAN emission algorithm, described by Guenther et al. (2006), scales a standard emission factor (ε) to local environmental conditions based on surface temperature (Ts), photosynthetically active radiation (PAR), leaf area index (LAI), and soil moisture (SM):5 ACKNOWLEDGEMENTS • The OMI HCHO signal before filtering shows evidence of contamination of the biogenic signal due to anthropogenic activity associated with oil extraction over the Niger Delta. Additionally, biomass burning smears the biogenic HCHO signal over the Congo basin – a region that is influenced by biomass burning from the northern and southern hemispheres. • The resulting filtered OMI HCHO slant columns for Africa are encouraging, as they show spatial consistency with the land cover distributed over Africa. The Congo Basin makes the largest contribution to the OMI HCHO signal, consistent with the broadleaf forest biome within this region, and with observations that show that the tropics account for about 80% of global isoprene emissions.5 There is also evidence in the OMI biogenic data of a distinct gradient from tropical vegetation to savanna-type biomes to barren or sparsely vegetated regions. • Some small-scale features that are visible over Africa include the forested belt along the east coast of South Africa, the vegetated strip along the Nile Delta, and the reduced signal over sparsely vegetated regions such as western South Africa and the Horn of Africa. This work was supported by the NASA ACMAP program. REFERENCES [1] Palmer et al. (2003), JGR, doi:10.1029/2002JD002153. [2] Otter et al. (2003), JGR, doi:10.1029/2002JD002609. [3] Janicot et al. (2008), Ann. Geophys., 26, 2569-2595. [4] Mari et al. (2008), ACP, 8, 3951-3961. [5] Guenther et al. (2006), ACP, 6, 3181-3120. [6] Langford et al. (2010), ACP, 10,8391-8412. where γ, the emission activity factor, is calculated using empirically-derived coefficients and the aforementioned environmental variables. The savanna biomes have a visible seasonal signals that correlate with precipitation in the north and Ts in the south. All regions, except the Congo Basin, are relatively well correlated with MEGAN isoprene emissions.