Download
1 / 65
650 likes | 804 Vues
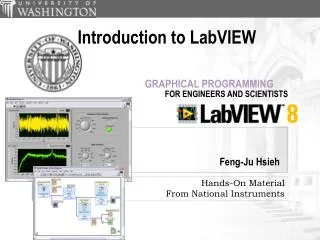
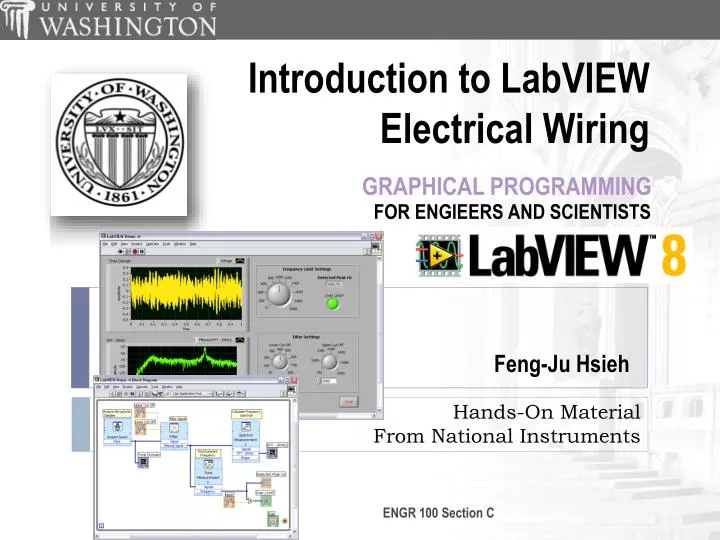
Introduction to LabVIEW Electrical Wiring. GRAPHICAL PROGRAMMING. FOR ENGIEERS AND SCIENTISTS. Hands-On Material From National Instruments. Feng-Ju Hsieh. Course Goals. Become comfortable with the LabVIEW environment and data flow execution

E N D
Introduction to LabVIEW Electrical Wiring GRAPHICAL PROGRAMMING FOR ENGIEERS AND SCIENTISTS Hands-On MaterialFrom National Instruments Feng-Ju Hsieh ENGR 100 Section C
Course Goals • Become comfortable with the LabVIEW environment and data flow execution • Ability to use LabVIEW to simulate Electrical Wiring • LabVIEW Concepts • Find and use math and complex analysis functions • Work with data types, such as Boolean, integer, and • Displaying ENGR 100 Section C
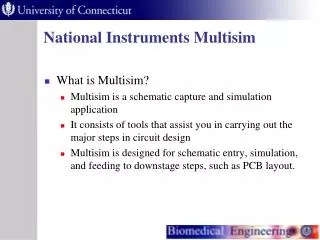
LabVIEW Graphical Development System • Graphical Programming Environment • Compile code for multiple OS and devices • Useful in a broad range of applications ENGR 100 Section C
Laptop PC PXI Modular Instrumentation PDA Desktop PC High-Speed Digitizers Counter/ Timers Distributed I/O and Embedded Control High-Resolution Digitizers and DMMs Multifunction Data Acquisition Dynamic Signal Acquisition Instrument Control Machine Vision Motion Control Digital I/O Signal Conditioning and Switching Unit Under Test The NI Approach – Integrated Hardware Platforms ENGR 100 Section C
Section I – LabVIEW Environment A. Getting Data into your Computer • Data Acquisition Devices • NI-DAQ • Simulated Data Acquisition • Sound Card B. LabVIEW Environment • Front Panel / Block Diagram • Toolbar /Tools Palette C. Components of a LabVIEW Application • Creating a VI • Data Flow Execution D. Additional Help • Finding Functions • Tips for Working in LabVIEW ENGR 100 Section C
A. Setting Up Your Hardware • Data Acquisition Device (DAQ) • Actual USB, PCI, or PXI Device • Configured in MAX • Simulated Data Acquisition Device (DAQ) • Software simulated at the driver level • Configured in MAX • Sound Card • Built into most computers Track A Track B Track C ENGR 100 Section C
What type of device should I use? ENGR 100 Section C * The above table may not be representative of all device variations that exist in each category
What is MAX? • MAX stands for Measurement & Automation Explorer. • MAX configures and organizes all your National Instruments DAQ, PCI/PXI instruments, GPIB, IMAQ, IVI, Motion, VISA, and VXI devices. • Used for configuring and testing devices. Icon Found on Windows Desktop ENGR 100 Section C
Exercise 1 – Setting Up Your Device Track B • Use Measurement and Automation Explorer (MAX) to: • Configure and test your Simulated Data Acquisition (DAQ) device ENGR 100 Section C
Open and Run LabVIEW Start»All Programs»National Instruments LabVIEW 8.6 » Startup Screen: Start from a Blank VI: New»Blank VI Start from an Example: Examples»Find Examples… or ENGR 100 Section C
LabVIEW Programs Are Called Virtual Instruments (VIs) • Each VI has2 Windows • Front Panel • User Interface (UI) • Controls = Inputs • Indicators = Outputs • Block Diagram • Graphical Code • Data travels on wires from controls through functions to indicators • Blocks execute by Dataflow ENGR 100 Section C
Controls Palette(Controls & Indicators) (Place items on the Front Panel Window) Customize Palette View Control: Numeric Indicator: Numeric Slide ENGR 100 Section C
Functions (and Structures) Palette (Place items on the Block Diagram Window) Structure: While Loop ENGR 100 Section C
Automatic Selection Tool Operating Tool Positioning/Resizing Tool Labeling Tool Wiring Tool Tools Palette • Recommended: Automatic Selection Tool • Tools to operate and modify both front panel and block diagram objects Automatically chooses among the following tools: ENGR 100 Section C
Status Toolbar Run Button Continuous Run Button Abort Execution Additional Buttons on the Diagram Toolbar Execution Highlighting Button Retain Wire Values Button Step Function Buttons ENGR 100 Section C
Demonstration 1: Creating a VI Front Panel Window Graph Indicator Block Diagram Window Output Terminal Boolean Control Input Terminals ENGR 100 Section C
Dataflow Programming • Block diagram execution • Dependent on the flow of data • Block diagram does NOT execute left to right • Node executes when data is available to ALL input terminals • Nodes supply data to all output terminals when done ENGR 100 Section C
Debugging Techniques • Finding Errors • Execution Highlighting • Probes Click on broken Run button. Window showing error appears. Click on Execution Highlighting button; data flow is animated using bubbles. Values are displayed on wires. Right-click on wire to display probe and it shows data as it flows through wire segment. You can also select Probe tool from Tools palette and click on wire. ENGR 100 Section C
Context Help Window • Help»Show Context Help, press the <Ctrl+H> keys • Hover cursor over object to update window • Additional Help • Right-Click on the VI icon and choose Help, or • Choose “Detailed Help.” on the context help window ENGR 100 Section C
Tips for Working in LabVIEW • Keystroke Shortcuts • <Ctrl+H> – Activate/Deactivate Context Help Window • <Ctrl+B> – Remove Broken Wires From Block Diagram • <Ctrl+E> – Toggle Between Front Panel and Block Diagram • <Ctrl+Z> – Undo (Also in Edit Menu) • Tools»Options… – Set Preferences in LabVIEW • VI Properties–Configure VI Appearance, Documentation, etc. ENGR 100 Section C
Section II – Elements of Typical Programs A. Loops • While Loop • For Loop B. Functions and SubVIs • Types of Functions • Creating Custom Functions (SubVI) • Functions Palette & Searching C. Decision Making and File IO • Case Structure • Select (simple If statement) • File I/O ENGR 100 Section C
Loops While Loop • While Loops • i terminal counts iteration • Always runs at least once • Runs until stop condition is met For Loop • For Loops • i terminal counts iterations • Run according to input N of count terminal ENGR 100 Section C
Drawing a Loop 2. Enclose code to be repeated 1. Select the structure 3. Drop or drag additional nodes and then wire ENGR 100 Section C
3 Types of Functions (from the Functions Palette) • Express VIs: interactive VIs with configurable dialog page (blue border) • Standard VIs: modularized VIs customized by wiring(customizable) • Functions: fundamental operating elements of LabVIEW; no front panel or block diagram (yellow) ENGR 100 Section C
What Types of Functions are Available? • Input and Output • Signal and Data Simulation • Acquire and Generate Real Signals with DAQ • Instrument I/O Assistant (Serial & GPIB) • ActiveX for communication with other programs • Analysis • Signal Processing • Statistics • Advanced Math and Formulas • Continuous Time Solver • Storage • File I/O Express Functions Palette ENGR 100 Section C
Searching for Controls, VIs, and Functions • Palettes are filled with hundreds of VIs • Press the search button to index the all VIs for text searching • Click and drag an item from the search window to the block diagram • Double-click an item to open the owning palette ENGR 100 Section C
Create SubVI • Enclose area to be converted into a subVI. • Select Edit»Create SubVI from the Edit Menu. ENGR 100 Section C
LabVIEW Functions and SubVIs operate like Functions in other languages Function Pseudo Code function average (in1, in2, out) { out = (in1 + in2)/2.0; } SubVI Block Diagram Calling Program Pseudo Code main { average (in1, in2, pointavg) } Calling VI Block Diagram ENGR 100 Section C
Exercise 3.1 – Analysis Track A,B,&C • Use LabVIEW Express VIs to: • Simulate a signal and display its amplitude and frequency This exercise should take 15 minutes. ENGR 100 Section C
How Do I Make Decisions in LabVIEW? • Case Structures • Select (b) (a) (c) ENGR 100 Section C
File I/O File I/O – passing data to and from files • Files can be binary, text, or spreadsheet • Write/Read LabVIEW Measurements file (*.lvm) Writing to LVM file Reading from LVM file ENGR 100 Section C
Section III – Presenting your Results A. Displaying Data on the Front Panel • Controls and Indicators • Graphs and Charts • Loop Timing B. Signal Processing • MathScript • Arrays • Clusters • Waveforms ENGR 100 Section C
What Types of Controls and Indicators are Available? • Numeric Data • Number input and display • Analog Sliders, Dials, and Gauges • Boolean Data • Buttons and LEDs • Array & Matrix Data • Numeric Display • Chart • Graph • XY Graph • Intensity Graph • 3D graph: point, surface, and model • Decorations • Tab Control • Arrows • Other • Strings and text boxes • Picture/Image Display • ActiveX Controls Express Controls Palette ENGR 100 Section C
Charts – Add 1 data point at a time with history Waveform chart – special numeric indicator that can display a history of values • Chart updates with each individual point it receives Functions»Express»Graph Indicators»Chart ENGR 100 Section C
Graphs – Display many data points at once • Waveform graph – special numeric indicator that displays an array of data • Graph updates after all points have been collected • May be used in a loop if VI collects buffers of data Functions»Express»Graph Indicators»Graph ENGR 100 Section C
Building Arrays with Loops (Auto-Indexing) Auto-Indexing Enabled Wire becomes thicker • Loops can accumulate arrays at their boundaries with auto-indexing • For Loops auto-index by default • While Loops output only the final value by default • Right-click tunnel and enable/disable auto-indexing 1D Array 0 1 2 3 4 5 Auto-Indexing Disabled Wire remains the same size Only one value (last iteration) is passed out of the loop 5 ENGR 100 Section C
Creating an Array (Step 1 of 2) From the Controls»Modern»Array, Matrix, and Cluster subpalette, select the Array icon. Drop it on the Front Panel. ENGR 100 Section C
Create an Array (Step 2 of 2) • Place an Array Shell. • Insert datatype into the shell (i.e. Numeric Control). ENGR 100 Section C
How Do I Time a Loop? 1. Loop Time Delay • Configure the Time Delay Express VI for seconds to wait each iteration of the loop (works on For and While loops). 2. Timed Loops • Configure special timed While loop for desired dt. Time Delay Timed Loop ENGR 100 Section C
Control & Indicator Properties • Properties are characteristics or qualities about an object • Properties can be found by right clicking on a Control or Indicator • Properties Include: • Size • Color • Plot Style • Plot color • Features include: • Cursors • Scaling ENGR 100 Section C
Math with the MathScript Node • Implement equations and algorithms textually • Input and Output variables created at the border • Generally compatible with popular m-file script language • Terminate statements with a semicolon to disable immediate output (Functions»Programming»Structures»MathScript) Prototype your equations in the interactive MathScript Window. ENGR 100 Section C
m-file Script The Interactive MathScript Window • Rapidly develop and test algorithms • Share Scripts and Variables with the Node • View /Modify Variable content in 1D, 2D, and 3D Variable Workspace Output Window View/Modify Variable Contents User Commands (LabVIEW»Tools»MathScript Window) ENGR 100 Section C
Review of Data Types Found in LabVIEW ENGR 100 Section C
Electrical Wiring 2-Way Switch 3-Way Switch 4-Way Switch LEVITION LEVITION LEVITION ENGR 100 Section C
Single 2-Way Switch Layout ENGR 100 Section C
3-3 Switch Layout ENGR 100 Section C
3-4-3 Switch Layout ENGR 100 Section C
Logic Gate ENGR 100 Section C
Logic Gate ENGR 100 Section C
Logic Gate ENGR 100 Section C