Download
1 / 10
100 likes | 229 Vues
Key Facts about the UK Consumer Magazine Industry. The UK consumer magazine industry is worth £2.8bn Over 3,200 consumer magazines are published in the UK Nearly 9 out of every 10 UK adults read magazines every year Nearly 1.5 billion consumer magazines are read in the UK each year

E N D
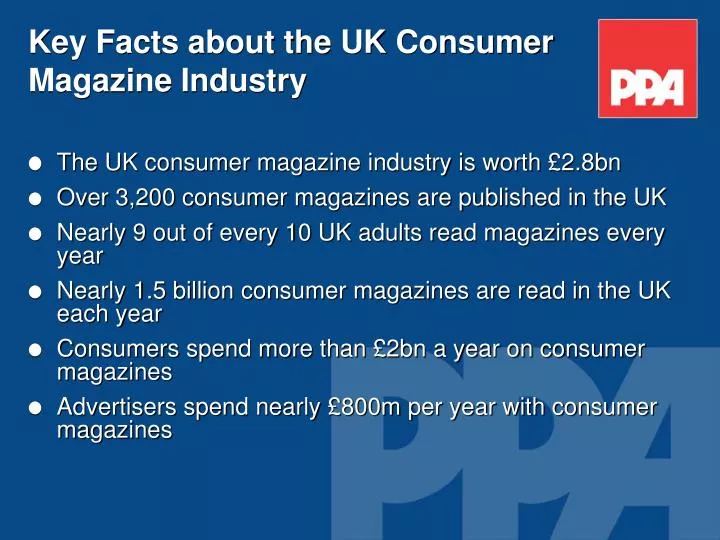
Key Facts about the UK Consumer Magazine Industry • The UK consumer magazine industry is worth £2.8bn • Over 3,200 consumer magazines are published in the UK • Nearly 9 out of every 10 UK adults read magazines every year • Nearly 1.5 billion consumer magazines are read in the UK each year • Consumers spend more than £2bn a year on consumer magazines • Advertisers spend nearly £800m per year with consumer magazines
The UK consumer magazine industry is worth £2.8bn • The total value of the UK magazine industry in 2007 was £5.7bn • Consumer magazines account for £2.8bn – 49% market share Value of Magazine Industry, 2007 (£m) Customer Magazines Consumer Magazines Business Magazines Source: PricewaterhouseCoopers
Over 3,200 consumer magazine titles are published in the UK • There are currently 3,243 consumer magazines in the UK • In the last 30 years, the number of consumer magazines has increased by 135% • In 1980, there were only 1,383 titles Number of titles 4,000 Number of Consumer Magazine Titles, 1980 - 2008 3,500 3,000 2,500 2,000 1,500 1,000 500 0 1980 1982 1984 1986 1988 1990 1992 1994 1996 1998 2000 2002 2004 2006 2008 Year Source: BRAD (Feb 2009)
Nearly 1.4 billion copies of consumer magazines are sold in the UK each year 2,000 Number of Copies of Consumer Magazines sold, 1980 - 2008 • 1.374bn copies of consumer magazines were sold in the UK in 2007 • At least a further 0.4bn copies were distributed for free or discounted in 2007 • The average person in the UK buys 22 copies a year 1,800 Copies Sold (m) 1,600 1,400 1,200 1,000 800 600 400 200 0 1980 1982 1984 1986 1988 1990 1992 1994 1996 1998 2000 2002 2004 2006 Year Source: AA/WARC
Top magazines by circulation Average Net Circulation (UK/ROI) Actively Purchased (UK/ROI) SkyMag 7,219,922 1,369,088 1 TV Choice Sky Sports 4,267,042 2 1,315,543 What’s On TV Sky Movies 3,511,747 1,018,704 3 Radio Times Asda Magazine 2,925,656 932,651 Take A Break 4 Tesco Magazine 2,016,878 647,064 Saga Magazine 5 National Trust 1,737,759 550,040 Reader’s Digest 6 Sainsbury’s Fresh Ideas 1,492,957 529,671 Closer 7 Skymag HD Special 1,400,000 498,776 Glamour 8 TV Choice 1,369,088 477,641 OK! 9 What’s On TV 1,315,543 454,818 Chat 10 Source: ABC, July-December 2008
Magazines reach at least 85% of UK adults Reach of Magazines, 2008 • In 2008, 85% of all adults reported reading one of the 184 titles listed on the NRS • 57% of adults “almost always” read at least one of these titles • On average, AIR adults* read NRS titles for 88 minutes every week * i.e. the 75% who are part of the Average Issue Readership of any NRS magazine Source: National Readership Survey, January – December 2008
Top magazines by readership Reach (Average Issue Readership) Volume of Reading per Issue Volume of Reading per Year 1 Take A Break SkyMag Take A Break 2 Radio Times Tesco Magazine National Trust 3 Asda Magazine What’s On TV SkyMag Your M&S OK! 4 National Geographic Sainsbury’s Mag Hello! Radio Times 5 Chat National Trust Reader’s Digest 6 Closer What’s On TV What’s On TV 7 Heat Sky Sports Saga Magazine 8 Auto Trader Take A Break Tesco Magazine 9 Boots H&B TV Choice OK! 10 Volume of Reading per Issue = Average Issue Readership x Mean time spent reading Volume of Reading per Year = Volume of reading per issue x Number of issues Source: NRS, January – December 2008
Consumers spend more than £2bn a year on consumer magazines • Consumers spend £2.1bn on magazines at current prices • This is equivalent to every person in the UK spending £36 a year on magazines • Expenditure on consumer magazines has grown in real terms by 88% since 1990 (see graph) Purchaser Expenditure of Consumer Magazines (Constant Prices, 2000, £m), 1980 - 2007 2,500 2,500 2,500 2,000 2,000 2,000 1,500 1,500 1,500 Purchaser Expenditure (£m), constant prices, 2000 1,000 1,000 1,000 500 500 500 0 0 0 1980 1980 1980 1982 1982 1982 1984 1984 1984 1986 1986 1986 1988 1988 1988 1990 1990 1990 1992 1992 1992 1994 1994 1994 1996 1996 1996 1998 1998 1998 2000 2000 2000 2002 2002 2002 2004 2004 2004 2006 2006 2006 Source: AA/WARC Year
Advertisers spent almost £750m with consumer magazines in 2008 • In 2008, advertisers spent £745m with consumer magazines • Advertising expenditure for all media except the internet declined year-on-year in 2008 Advertising Expenditure (Current Prices) by Medium, 2003-2008 18,000 17,081 16,333 16,423 16,207 791 15,809 745 Consumer Magazines 16,000 812 968 827 14,810 819 839 Business Magazines 1,016 1,064 976 784 1,082 938 Outdoor 933 14,000 897 1,048 848 2,171 Direct Mail 2,040 786 2,322 2,371 170 12,000 2,469 168 Cinema 155 2,467 158 2,747 Regional Newspapers 2,313 160 Advertising Expenditure (£m), current prices 10,000 149 2,782 2,994 3,132 National Newspapers 1,805 1,933 2,962 8,000 454 Radio 1,913 497 1,912 1,974 480 6,000 521 1,902 3,819 TV 545 4,016 526 4,000 3,905 4,097 3,955 3,722 2,000 3,300 Internet* 2,813 2,016 1,367 825 465 0 Source: AA/WARC 2003 2004 2005 2007 2008 2006
The growth of internet advertising has affected share for all other media • The growth of internet advertising has led to a decline in share of expenditure for all other media, except outdoor Share of Advertising Expenditure (Constant Prices, 2000) by Medium 100% 4.5% 4.6% 5.3% 5.2% Consumer Magazines 5.1% 5.0% 5.1% Business Magazines 5.7% 6.2% 6.6% 6.8% 7.1% 90% 5.7% Outdoor 5.7% 5.7% 5.5% 5.4% 5.3% 80% Direct Mail 12.4% 12.7% 14.2% 14.6% 15.6% 16.7% 1.0% Cinema 1.0% 70% 0.9% 1.0% 1.0% 1.0% 14.1% Regional Newspapers 16.1% 60% 17.0% 18.5% 19.8% 20.0% National Newspapers 11.0% 50% 11.3% 11.7% 2.8% Radio 11.8% 2.9% 12.5% 40% 12.8% 2.9% 3.2% 3.4% 23.2% Television 3.5% 30% 23.5% 23.9% 25.3% 20% 25.0% 25.1% 20.1% 10% Internet* 16.5% 12.3% 8.4% 5.2% 3.1% 0% 2008 2005 2006 2007 2003 2004 Source: AA/WARC * = Estimates for Q3 & Q4 2008