Download
1 / 44
440 likes | 647 Vues
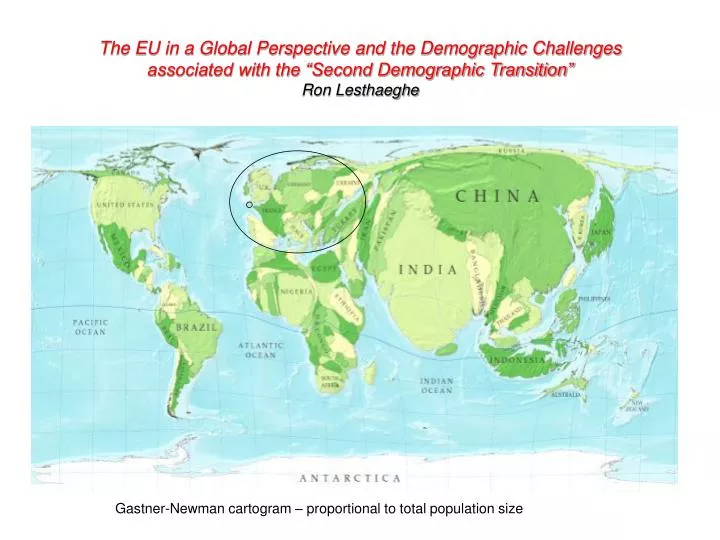
The EU in a Global Perspective and the Demographic Challenges associated with the “Second Demographic Transition” Ron Lesthaeghe. Gastner-Newman cartogram – proportional to total population size. Part 1: The formal demographic core. The 2 mechanisms of ageing.

E N D
The EU in a Global Perspective and the Demographic Challenges associated with the “Second Demographic Transition” Ron Lesthaeghe Gastner-Newman cartogram – proportional to total population size
Part 1: The formal demographic core. The 2 mechanisms of ageing. Population growth (shrink) momentum. Replacement migration.
Survivors per 100 000 births with varying life expectancies at birth : From a “neutral” mortality decline to squaring off and pure aging effect
The stationary population view: from a neutral mortality decline to pure aging
Stable population age structures with constant e0= 80 years, but varying total fertility rates. (1.58 to 2.20) TFR
The Negative Growth Momentum In closed populations that have grown very old as a result of sustained sub-replacement fertility, there will be a CONTINUED shrinkage for 50 years AFTER the restoration of exact replacement fertility
Aging bulge: unavoidable After a long period of subreplacement fertility, there is an unavoidable aging bulge even if fertility returns to replacement level
The “Second Demographic Transition” view • Primary determinants of below replacement fertility: • Economic : Elevated standard of living & high consumption aspirations, need for double income, high opportunity cost globalization world economy. • Cultural : Higher order needs accentuated (self-actualization, expressive values, individual autonomy, freedom of choice, open future,”postmaterialist” political aspirations …)(cf. Maslow’s hierarchy of needs) • TOGETHER Second Demographic Transition (SDT) • Demographic characteristics of the SDT: • Postponement of marriage and parenthood, use of efficient contraception. • But : varying degrees of catching up of fertility at later ages (main source of difference between TFRs above and below 1.5) • Hence structural, not temporary, sub-replacement fertility, but at varying levels ! • Rise of alternative living arrangements : longer periods living with parents, living alone, in cohabitation, procreation within cohabitation, post-marital cohabitation, LAT relations, etc. • Caveat : Intermediate phase between First DT and Second DT : Sexual revolution, but no transition to efficient contraception = recipe for high teenage fertility, shotgun marriage, young age divorce, early single motherhood, compromised life chances. US is typical example. One of the main reasons for US TFR being = 2.0.Also major danger for 1st generation immigrant youths from non-patriarchal societies.
The Fertility Story • Careful with period measures !! • Postponement & Recuperation in Cohort Fertility • The Spanish Cohorts
a positive association between SDT and period total fertility : classic case of split correlation All stronger recuperation countries No or weak recup & late starters 1.50 Source of plot : Tomas Sobotka, 2008. Interpretation : Ron Lesthaeghe 2008.
A strong SDT – fertility postponement link SDT tail SDT vanguard Source: T. Sobotka 2008.
TROUGH RECUP PTFR(t+30) = A + B1*BaseCTFR(t=0) + B2*TROUGH(t) + B3*RECUP(t) + e Trough = deficit in cumulated CASFR at age 30 compared to base Recup = part of trough recuperated by age 40 Sample= all never communist European countries, baseline = cohort born 1940-44, predicting PTFRs in period 1960-2005. RESULT : baseCTFR only Rsq. = .505, baseCTFR + Trough Rsq= .673, all 3 including Recup then Rsq= .793. Hence : RECUP IS ESSENTIAL. ONLY countries dip below a TFR below 1.5 that have no or weak recuperation. The “Bongaarts’ babies” have remained in his cupboard in a large number of countries, and will stay there for as long as there is no recuperation of fertility after age 30.
Cohort Fertility Postponement & Recuperation, Spain. (benchmarks coh40, coh55)
SDT and TFRs : inconsistent or double effect ? Social & Economic constraints: longer education, deregulation labour market etc + _ Postponement Self-actualisation, keeping open future. Overall fertility SDT Emancipation: gender equity & better division of labour in family. + Recuperation + Organisation & policy aspects re independence of young adults and reduction opportunity costs (child care facilities, schooling, allowances & benefits), housing opportunities.
FAC1_1: SDT – Postponement of Marriage, Parenthood and Overall Fertility, 1995-2001
FAC5_1: SDT – Non-conformist Family Formation (Cohabitation, out-of wedlock fertility, single parent household, abortion), 1995-2002
The Migration Issue Results of a simulation excercise for the EU-12, 1995 to 2060
Population 65+ in EU 15 in 3 Scenarios Scenario with constant dependency ratio leads to irrealistic growth and growth waves. xxxxx Note : UN assumes instantaneous drop immigrant fertility level to that of host country – too strong ! UN Population Divn.
EU-12 Female Pop. EU-12 aging if e0=80 and TFR=1.64. 1985 =>2060 15 9 3 0 Migrant extra female population. growth of immigrant population EU-12 , stock in 1985 + Descendants+ 400 000 newcomers p.a., fertility drops from 4 to 1.64 in 2010 3 2 1
Disaggregated projection for EU12 women, 1985-2060 Foreign stock of 1985 ( old survivors) and all foreign born after 1.1.85 Descendents of foreign mothers but born in EC12 after 1.1.85 EU12 nationals + descendants SCENARIO: everyone e0=80; immigration=400.000 pa.;TFR nationals=1.64, TFR immigrants drops from 4.0 to 1.64 by 2010
Religious composition of the population, example of Spain Age & Religion Composition, IIASA projections for Spain. 2009, 2019, 2029. Source : Katja Sherbov, Dec 2010 Dark blue: active Catholic Light blue : Non-active Cath. Green: Islam-Sunni Black: Islam-Sharia Purple: Protestant + other Red : Agnostic (Read outward)
Long term SDT – views : • Sustained below-replacement fertility, caused by postponement and very little progression beyond 2 children. Rise childlessness among couples. • But very different TFR levels (say from 1.0 to 2.0), depending on degree of fertility recuperation at later ages (30+) • Negative population growth momentum set in motion : population becomes so old that decline will not stop when TFR reaches replacement again. Decline continues for another 50 years. Unavoidable major aging bulge too. • Need for replacement immigration, but mainly useful for maintaining absolute sizes of total population or of total active population. Less useful for reducing aging ( but not useless !) • Replacement migration = family migration or family reunification, not just temporary guest workers. • But once TFRs remain below 1.5 : no adequate solutions anymore. • Hence strong connection between SDT and international migration. • And also : SDT leads to multi-cultural, multi-ethnic and multi-lingual societies, which can have very different degrees or patterns of integration. • SDT = no convenient equilibrium !
Part 2. Various measures compared • BUT !!! • ONLY the DENOMINATOR CONSIDERED HERE, I.E. THE ECONOMICALLY ACTIVE POPULATION • NOT THE NUMERATOR: DEPENDENT PENSIONERS. • 3 MEASURES COMPARED • Increase in fertility • Increase in Labour Force participation rates ( activity rates) • Increase in immigration
MacDonald-Kippen Total Labour Force Projection Scenarios • Effect of TFRs returning to 1.80 children in next 15 yrs ( starting +- in 2000) • Effect of Rises in Labour Force Participation rates : Males : after age 30 rising to levels of 1970; Females : rising to Swedish levels at all ages ; change over next 30 yrs. • Effect of Increasing Net Migration to 0.5 pct of Total Pop. Size : D=200.000pa =>408.000, F & UK= 35.000 => 290.000, US= 760.000 => 1.369.000 pa.
Optimistic Combination LF partic to high levels MIGR = 0.5% pa TFR to 1.8 BAU ALL CURRENT TFR, MIGR, LF Particip. CURRENT TFR, LF particip, NO MIGR
Homework for entire EU • Favor gender symmetry in housework & earnings; • Maintain & increase female employment rates, but reduce opportunity costs (child-care !!!) • Do not reduce immigration, but try to manage it with respect to education and favorable adjustment characteristics. • Increase labor force participation rates, esp. after age 55.
Can the SDT spread to non-western populations ? • Overall answer : spread of SDT already occurring in other societies, but not necessarily according to a western sequence. • Lowest-Low fertility in Japan, S. Korea, Singapore, Hong Kong, now also caused by massive postponement.. • Sub-replacement fertility in Caribbean area (from Cuba to Trinidad ), in 2 Indian states and several Indian metropolitan areas, and even in several Muslim populations (Tunisia, Iran). Sub-replacement fertility widespread in most Chinese provinces. • Take off of premarital cohabitation documented in Japan and Taiwan. “Cohabitation boom” in Latin America. • In Japan, Korea, Singapore : postponement of parenthood equally linked toexpressive and individualistic value orientations at the micro level ( but not or less strongly to religion/secularism). • But : many of these societies have no experience with multi-culturalism (e.g Japan, S. Korea versus Singapore)
Future of migration as seen through the SDT perspective.* Migration will continue to gain importance.* Many populations still have high TFRs, and large countries such as India, Pakistan, Bangladesh, Philippines, Indonesia, Mexico …will still produce a positive population growth momentum for several decades to come.* Several African populations ( lower on AIDS) have very high fertility and are also exhibiting a major growth momentum.* No shortage of areas with high population pressure in the next half century, but older and more typical recruitment areas may have reduced capacities for sending migrants. * Hence : geographical/cultural shifts are likely with respect to areas of origin.* Caveat : migrations can also occur even if sending country has very low fertility ( e.g. Polish, Eastern European migration to EU).
Conclusions • No way to stop ageing via replacement migration alone : numbers completely irrealistic (unless “deportation”) • Replacement migration is only a partial measure which works best if immigrants are in families, sex-balanced, with fertility at or above replacement level. Single sex labour migration is not demographically sound. • Replacement migration leads to “multicultural” societies, but it takes several generations to get to a decisive shift with respect to “ancestral origins”. Question : are the third and fourth generations “integrated”? • Short term imperatives for D,NL,B : increase labour force participation after age 50 ! • Overall : increase productivity via technological innovation and sound capital investment. And reduce public debt !!
IS THERE ENOUGH TO GO AROUND ? In millions, UN Medium projections, 2006 revisions. Total Pop 2005 2050 Increase Europe ( incl Eur. Russia) 731.1 664.1 - 67.0 Turkey 73.0 98.9 +25.9 Philippines 84.6 140.5 +55.9 Bangladesh 135.2 254.1 +118.9 India 1134.4 1658.3 +523.9 Pakistan 158.1 292.2 +134.1 Indian subcontinent +776.9 PR China 1313.0 1408.8 +95.8
Can the SDT spread to non-western populations ? • Overall answer : spread of SDT already occurring in other societies, but not necessarily according to a western sequence. • Lowest-Low fertility in Japan, S. Korea, Singapore, Hong Kong, now also caused by massive postponement.. • Sub-replacement fertility in Caribbean area (from Cuba to Trinidad ), in 2 Indian states and several Indian metropolitan areas, and even in several Muslim populations (Tunisia, Iran). Sub-replacement fertility widespread in most Chinese provinces. • Take off of premarital cohabitation documented in Japan and Taiwan. • In Japan, Korea, Singapore : postponement of parenthood equally linked toexpressive and individualistic value orientations at the micro level ( but not or less strongly to religion/secularism). • But : many of these societies have no experience with multi-culturalism (e.g Japan, S. Korea versus Singapore)
Postponement + stronger recuperation Less postponement but quantum drop Postponmt + weak or no recuperation