Download
1 / 25
250 likes | 257 Vues
China’s Impact on Latin America An Angel or a Devil for Latin Emerging Economies?. Javier Santiso Chief Development Economist & Deputy Director OECD Development Centre. ABCDE World Bank Tokyo 29-30 May 2006. 1. The cognitive effect: new emerging capitalisms. 2.

E N D
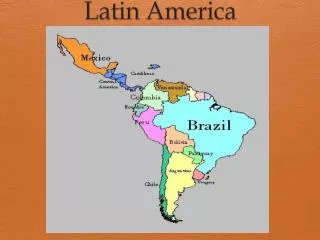
China’s Impact on Latin AmericaAn Angel or a Devil for Latin Emerging Economies? Javier Santiso Chief Development Economist & Deputy Director OECD Development Centre ABCDE World Bank Tokyo 29-30 May 2006
1 The cognitive effect: new emerging capitalisms. 2 The trade effect: the dark side of the boom. 3 China and India as a wake up call.
China: extraordinary or back to normal? According to IMF estimates Chinese gross domestic product based on purchasing-power-parity (PPP) amounts to 13.6% of 2005 world GDP (20.7% in the case of USA).
Korea&Japan 12.7% US 29.6% EU 30.7% LatAm 4.8% The cognitive impact: The emergence of new capitalisms. Center and Periphery rebalanced… GDP share of world output (WEO, 2004) Emerging Asia 8.0% China 4.2% Asiarepresents more than one fifth of world output.
China has doubled its GDP in 8 years…without the help of Money Doctors! PPP per capita GDP in constant prices (thousand of US$, 2004-5 estimate) Source: based on WEO and PWT Chinese growth rates has been higher than those observed in Brazil and Mexico during their glorious years.
Asia´s growthon an outward looking strategy: a development strategy to follow. … and its share in world merchandise trade has doubled in less than a decade. Source: IMF DOTS China’s trade openness surpasses that of all Latin American countries … Source: WTO, National Statistics
1 The cognitive effect: new emerging capitalisms. 2 The trade effect: the dark side of the boom. 3 China and India as a wake up call.
Are raw material prices facing a Chinese shock? Source: University of Oxford Many economists are putting the blame on China and -to a lesser extent- on other emerging economies (India) for the current increase in raw material (70% in real terms).
The stars have been lined up for Latin America:Commodity boom has been a bonanza Source: BBVA from original FMI and Bloomberg data; * Projection
The stars have been lined up for Latin America:Commodity boom has been a bonanza Exports of commodities BBVA-MAP Index of Latin America commodity prices (100 =jan03) over total exports (2004) 170 160 Venezuela 83.1% 150 Peru 70.7% 140 Without oil 130 Chile 59.1% 120 Colombia 46.3% 110 TOTAL 100 Argentina 38.0% 90 Brazil 29.6% 80 70 Mexico 14.6% 60 1996 1997 1998 1999 2000 2001 2002 2003 2004 2005 Latam 31.2% Source: BBVA Source: BBVA
The stars have been lined up for Latin America:Asia is becoming a major growth pilar Exports of agricultural, energy and minery products (in % over the total) (2003) 100 90 Latin America 80 70 60 50 40 30 20 10 0 India Chile UK China Bolivia Italy Peru US Ecuador Spain Uruguay Brazil Japan Colombia Paraguay Indonesia Argentina Taiwan France Venezuela Mexico Canada Thailand Malaysia Belgium Germany Singapore Hong Kong Netherlands South Korea Source: WTO
The stars have been lined up for Latin America:China became a major trading partner Growth of GDB in China (Annual Percentage variation) Exports to China in 2003 (Percentage of total) Source: Based on domestic sources. Figures for 2004 and 2005 are forecasts
Source: BP Source: JP Morgan estimates China´s strong demand for energy and commodities: a bonanza or a threat? Source: BBVA, Cochilco
China’s demand for commodities: a bonanza or a threat? Source: C.HJ.Kwan, Nomura Institute of Capital Markets Research Source: Blázquez, Rodríguez and Santiso (2006)
Does China compete with Latin American countries ? Source: Blázquez, Rodríguez and Santiso, OECD Development Centre (2006)
Does China compete with Latin American countries ? Source: Blázquez, Rodríguez and Santiso, OECD Development Centre (2006)
Does China compete with Latin American countries ? Source: Blázquez, Rodríguez and Santiso, OECD Development Centre (2006)
Trade Balance with China 3000 US$ millions 2.385 2500 2000 1.729 1.694 1500 966 1000 574 500 0 2001 2002 2003 2004 2005p China has become a major destination of Brazilian exports: The bonanza. Major countries of destination of Brazilian exports 1999 2004 United States 22,6% 1º United States 21,1% Argentina 11,2% 2º Argentina 7,6% Netherlands 5,4% 3º Netherlands 6,1% 4º China 5,6% Germany 5,3% Japan 4,6% 5º Germany 4,2% Italy 3,8% 6º Mexico 4,1% Belgium 3,8% 7º Italy 3,0% United Kingdom 3,0% 8º Japan 2,9% France 2,5% 9º Chile 2,6% Spain 2,4% 10º France 2,3% Mexico 2,2% 11º United Kingdom 2,2% Chile 1,9% 12º Spain 2,1% Russia 1,6% 13º Belgium 2,0% Paraguay 1,6% 14º Russia 1,7% China 1,4% 15º Venezuela 1,5% Source: SECEX Source: BBVA
Herfindahl-Hirschmann Concentration Index of Herfindahl-Hirschmann Concentration Index of Brazilian exports by industry, 1990-2003 Brazilian exports by country of destination 0,20 0.12 0,18 0.11 0,16 concentration more +concentration 0.10 0,14 0,12 0.09 0,10 0.08 0,08 concentration less 0.07 0,06 0,04 +diversification 0.06 0,02 0.05 0,00 1990 1991 1992 1993 1994 1995 1996 1997 1998 1999 2000 2001 2002 2003 Jan-95 Jan-96 Jan-97 Jan-98 Jan-99 Jan-00 Jan-01 Jan-02 Jan-03 Jan-04 Jan-89 Jan-90 Jan-91 Jan-92 Jan-93 Jan-94 Source: WTO. Brazilian exports of primary products: more is not better (Dutch disease and monopsony). Source: BBVA and Bradesco
1 The cognitive effect: new emerging capitalisms. 2 The trade effect: the dark side of the boom. 3 China and India as a wake up call.
China competes intensively with Mexico on a global level Source: Blázquez, Rodríguez and Santiso (2006)
Mexico’scompetitive advantage: proximity to export markets Mexico benefits from its geographic proximity to its major export markets: • Lower transport and communication costs • Access to FTA • Just-in-time delivery 24 Days 4 Days 160 Km 11,700 Km Shipping time Mexico is more competitive in manufacturing more sophisticated products which require frequent communication with the client or supplier and short reaction times.
Conclusions: A Watch List • Africa and Latin America: Out of the Value-Chain Game? • The share of China’s total exports produced by foreigners has risen sharply, from 32% to 60% between 2000 and 2005. • Foreign outsourcing is becoming a major driver of India’s and China’s high tech exports, both countries moving up quickly in the value added ladder. • In 2005 for example, of China’s top 100 exporters, 53 were foreign companies and all were electronics/information technology companies.
Thank you Based on Jorge Blázquez, Javier Rodríguez and Javier Santiso, “Angel or Devil? Chinese Trade Impact on Latin American Emerging Markets”, OECD Development Centre, Working Paper, May 2006.