Download
1 / 55
550 likes | 719 Vues
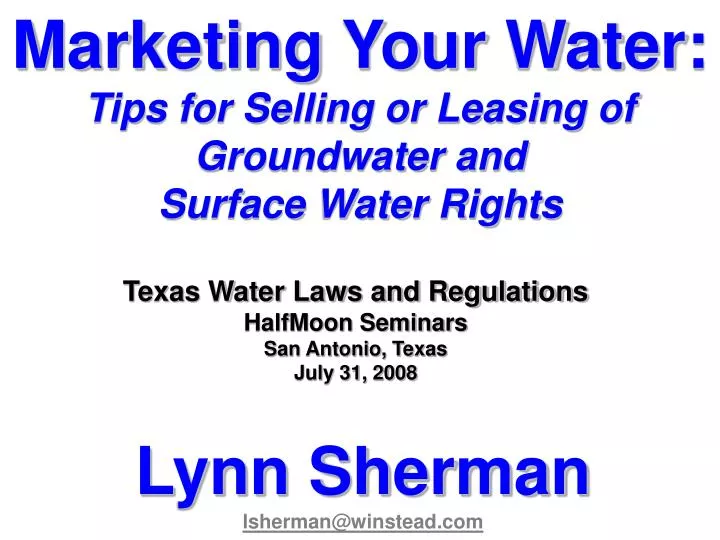
Marketing Your Water: Tips for Selling or Leasing of Groundwater and Surface Water Rights. Texas Water Laws and Regulations HalfMoon Seminars San Antonio, Texas July 31, 2008. Lynn Sherman lsherman@winstead.com. ALMOST ON PAR WITH 50’S DROUGHT. Developed Supplies Per Capita. 1950’s.

E N D
Marketing Your Water:Tips for Selling or Leasing of Groundwater and Surface Water Rights Texas Water Laws and Regulations HalfMoon Seminars San Antonio, Texas July 31, 2008 Lynn Sherman lsherman@winstead.com
ALMOST ON PAR WITH 50’S DROUGHT Developed Supplies Per Capita 1950’s TODAY
DAM BUILDING ERA “NO DEVELOPMENT” PERIOD 1980’s to Date 1960’s-1980’s Water Development Timeline DEVELOPED SUPPLIES 1950’s DROUGHT
Number and Capacity of Large Reservoirs Completed by Decade Source: GAO, July 2003, “Freshwater Supply: States’ Views of How Federal Agencies Could Help Them Meet the Challenges of expected Shortages,” GAO-03-514.
Currently, our “dam builders,” the Bureau of Reclamation and the Corps of Engineers, have only onelarge water storage project underway in the entire country.
NEEDED SUPPLIES POPULATION DOUBLES IN 2050 UNPARALLELED GROWTH EXISTING SUPPLIES DECREASE BY 20% DAM BUILDING ERA “NO DEVELOPMENT” PERIOD FUTURE 1980’s to Date 1960’s-1980’s Water Development Timeline DEVELOPED SUPPLIES 1950’s DROUGHT
2007 2002 State Water Plan “if a drought occurs in 2050, almost half (43 percent) of the municipal demand could not be satisfied by current sources.” if a drought occurs in 2060, about 85 percent of the municipal demand could not be satisfied by current sources.
We need 3.7 million acre-feet of new waterby 2010. That is20%of current developed supplies and 1/2 of our additional long term need.
That is almost enough water to flood every city in Texas ½ foot deep. And, it is needed in 2010.
2002 2007 State Water Plan Cost of Necessary New Projects = $30.7 billion approx. $18 billion
since 1980, federal spending has been flat. CBO, May 1999, “Trends in Public Infrastructure Spending”
Actually, in real terms . . . FEDERAL SPENDING 70% In Last Twenty Years
Federal Spending State Spending Local Spending
3 out of 10drinking water utilities and 4 out of 10 wastewater utilities do not collect enough revenue from users and other local sources to cover the cost of service. Source: GAO, March 2004, “Water Infrastructure: Comprehensive Asset Management Has Potential to Help Utilities Better Identify Needs and Plan Future investments” GAO-02-764.
Myth #1 There is no demand for private capital or involvement of the private sector
What are the benefits of private capital? availability & risk
Typical Project Risk/Return Profile 50 Risk Return 40 Potential Return 30 Level of Risk/Return ($ millions) 20 10 0 1 3 4 5 6 7 8 9 2 10 11 12 13 14 15 16 17 18 19 20 21 22 23 24 25 26 27 28 29 30 Project Phase (years) Proposal Development Construction Operation Residual Source: The National Council for Public Private Partnerships
Compare experience in solid waste • Crisis in early ’80s due to declining landfill capacity and increasing costs. • Congress responded by eliminating tax-exempt private activity bond cap for municipal solid waste disposal projects. • As a result, over $15 billion in PABs have been issued since 1986 to solve the crisis. Source: Stephen H. Howard, Sr. V.P., Lehman Brothers, Inc., testifying to the Congressional Transportation and Infrastructure Subcommittee on Water Resources and Environment, June 14, 2005.
Popularity of Financing Methods Source: U.S. Conference of Mayors Urban Water Council, “National City Water Survey 2005.”
Myth #2 Water marketing will result in price gouging
Why “price gouging” will not occur? • Water is not sold on a wholesale basis unless it is cheaper than the next best alternative. • There are no government granted monopolies for the sale and distribution of wholesale water. • Private wholesalers have no ongoing rate setting authority, so rate increases must be set out in the initial contract.
Myth #3 Water marketing will result in abuse of the right of capture
How to Value a Water Right
Sr. A F E Sr. C B G D G3 G1 G2
County Growth from 2000 to 2025 Source: Lieutenant General Robert B. Flowers, Chief of Engineers, U. S. Army Corps of Engineers, before the Subcommittee on Water Resources and Environment, Committee on Transportation and Infrastructure, United States House of Representatives, May 7, 2003. Pricing Considerations(certainly not an exhaustive list) • Demand Growth
Pricing Considerations(certainly not an exhaustive list) • Demand Growth • Adequacy of existing supplies
Cities surveyed nationwide that do not have an adequate 20-year water supply? ___ 35% Source: U.S. Conference of Mayors Urban Water Council, National City Water Survey 2005.”
Pricing Considerations(certainly not an exhaustive list) • Demand Growth • Adequacy of existing supplies • Susceptibility to drought
“at least some part of the United States has experienced severe or extreme drought conditions every year since 1896.” Source: GAO, July 2003, “Freshwater Supply: States’ Views of How Federal Agencies Could Help Them Meet the Challenges of Expected Shortages,” GAO-03-514, p. 15.
Areas Prone to Drought 1895 to 1995 Source: GAO, July 2003, “Freshwater Supply: States’ Views of How Federal Agencies Could Help Them Meet the Challenges of Expected Shortages,” GAO-03-514, Figure 3.
Adequacy of Stored Supplies During a Significant Drought Source: S. Roy, et al., October 2005, “Evaluation of the Sustainability of Water Withdrawals in the United States, 1995 to 2025,” Journal of the American Water Resources Association, calculated using typical withdrawals and the lowest 3-year rolling average precipitation between 1934 and 2002 based on data from Solley et al. (1998) and CPC (2003).
Pricing Considerations(certainly not an exhaustive list) • Demand Growth • Adequacy of existing supplies • Location • Susceptibility to drought • Total Quantity • Established Water Market • Water Quality
According to the EPA, 45% of assessed waters nationwide do not fully meet water quality standards Source: ASCE, et al., September 2004, “All Dried Up: How Clean Water is Threatened by Budget Cuts.”
Pricing Considerations(certainly not an exhaustive list) • Demand Growth • Interbasin Transfer • (surface water) • Adequacy of existing supplies • Location • Instream and Other • Natural Flow Needs • Susceptibility to drought • Total Quantity • Established Water Market • Water Quality • Development Costs • (e.g., infrastructure, pumping, treatment) • Storage/Firm Supply/ • Dependability • Seniority/Potential Effects • on Others
The environmental condition of our coastal areas is largely Fair to Poor. Source: U.S. EPA, December 2004. National Coastal Condition Report II. Office of Research and Development/Office of Water. EPA-620/R-03/002. Overall national and regional coastal condition between 1997 and 2000.
Pricing Considerations(certainly not an exhaustive list) • Demand Growth • Interbasin Transfer • (surface water) • Adequacy of existing supplies • Location • Instream and Other • Natural Flow Needs • Susceptibility to drought • Total Quantity • Indirect Reuse Potential • Established Water Market • Operating History • Applicable Rules and Regs • Water Quality • Local Considerations • (e.g., economic and political) • Development Costs • (e.g., infrastructure, pumping, treatment) • Existing Rates • Storage/Firm Supply/ • Dependability • Export Fees and Taxes • Timing • Seniority/Potential Effects • on Others
Shorthand Standard: Cheaper than the next best alternative Marginal Cost/Value Pricing ― all things considered.
Example: City of Round Rock
Pricing Examples
1,000 $13,000 ≈ most expensive (Source: Wine Spectator, April 30, 2003) $11,280 = evian (@ 82nd and Quaker) gallons of water $1.83 = City of Lubbock tap water
Ag vs. Urban Values
In California, an acre-foot used in the semi-conductor business produces $980,000 in gross state revenue, while the same acre-foot generates only $60 when used on cotton or alfalfa.
In the Rio Grande Valley, the average transfer from ag to urban use produced net benefits of $10,000 per acre-foot in 1992.
$747 Ag-to-Urban $197 Ag-to-Ag Western State Water Transfers: Average Price Comparison (annual price per acre-foot) Based on 1,836 transfers in 12 western states from Jan. 1987 to Dec. 2005. J. Brewer, R. Glennon, A. Ker, and G. Libecap, “Water Markets: Western Water Transfers from Agriculture to Urban Uses, 1987-2005” (Sept. 1, 2006).