Download
1 / 18
180 likes | 188 Vues
The oversubsidized periphery - who benefits?. David Byrne Radstats Annual Conference Edinburgh March 1 st 2008. Abstract.

E N D
The oversubsidized periphery - who benefits? David Byrne Radstats Annual Conference Edinburgh March 1st 2008
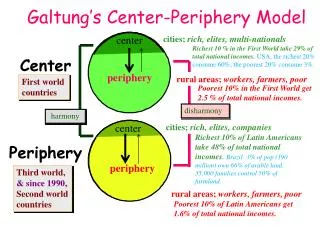
Abstract Under the Barnett formula the UK's peripheral subnations receive considerably more in public expenditure per head than is the case in England. Whilst relative need indices provide some justification for this in the case of Northern Ireland and to a lesser extent Wales, Scotland as a whole benefits very substantially in comparison with the three regions of the North of England - North East, North West, and Yorks and Humberside which together have more than three times Scotland's population and are substantially more deprived in total on need indicators. However, who benefits from this comparitive largesse towards Scotland? There is clear evidence that the primary beneficiaries in Scotland are middle and higher income households who have access to better health care, free social care, and free higher education. This presentation will review the relationship between need indices and resource allocation across English regions, Wales, Scotland and Northern Ireland and then examine available spatial and social structural data on public expenditure to explore just who in Scotland actually benefits from the resource allocation imbalance.
III How the Barnett Formula works at presentA. The mechanism The formula currently applies to the Scottish and Welsh ‘blocks’ which now cover all expenditure within the responsibilities of the Secretaries of State for Wales and Scotland except‘agriculture, fisheries and food’ and finance for nationalised industries. In both countries the block currently accounts for some 96% of all spending by the territorial department. The formula is used in determining the aggregate size of the block which the relevant secretaries of state are then free to allocate between services as they see fit. However, as much public spending is on-going or demand-led, the scope for the exercise of this discretion is limited in practice. Each year the public expenditure survey (PES) process determines departmental expenditure plans for three years ahead so that in the case of the 1997 round, the years would have been 1998/99, 1999/00 and 2000/01.10 At the start of a public expenditure round a new year is added to the survey: in the case of the 1997 round, the year would have been 2000/01. The initial level of the blocks in this year is determined by the Treasury using rules applied to all departments. In broad terms this normally involves a percentage up-lift on expenditure in the year before. Thereafter, if there are changes to the plans for English programmes that are ‘comparable’ to the Scottish and Welsh blocks, then a fixed proportion is added to - or in the case of cuts subtracted from - the block. These proportions are population based and, until 1992, reflected (in rounded form) mid-1976 population estimates. However, in 1992, they were revised, for the first time, to reflect data from the 1991 Census of Population. The ratios are set out in the following table: Thus, for example, if £1 billion is added to planned health service expenditure in England, then £106.6 million is added to the Scottish block and £60.2 million to the Welsh block.
Wikipedia on issues re Barnett the continuing distribution of a per-capita amount to each devolved areas higher than that allocated to England still continues to attract calls for the formula to be re-negotiated. Using figures for the financial year 2006/2007 (source: HM Treasury, Public Expenditure Statistical Analyses (PESA)), if a UK-wide per-capita average was a notional 100% then identifiable per-capita expenditure on services in England would be 97% and the Scottish amount 117%. Wales would be 111% and Northern Ireland 127%. This comprises all expenditure that can be identified as being to the benefit of a particular country. It does not, however, take account of 'non-identifiable expenditure', such as defence and debt interest, which are deemed to be for the benefit of the entire UK, regardless as to where the monies are actually spent.
Consequences 2003-4 "Identifiable" government expenditure in Scotland (spending specifically incurred on behalf of the residents of Scotland) was £37.2 billion, or 10.1 per cent of the corresponding UK total, which translates into the largest per head expenditure after Northern Ireland. Scotland's identifiable expenditure on services is about 19 per cent higher than in the UK on average. http://www.scotland.gov.uk/News/Releases/2005/12/14094600
Payments to Scottish Students Fees, Grants and Bursaries £261,594,000 Student Awards Agency for Scotland Annual report and accounts 2006-2007
Table 1.1 Socio-economic characteristics of undergraduates Scottish Universities Social class • Managerial & Professional 52% • Intermediate 22% • Routine and manual +unemployed 20% • Missing 6% Family member studied at university • Yes 68% HIGHER AND FURTHER EDUCATION STUDENTS’ INCOME, EXPENDITURE, AND DEBT IN SCOTLAND 2004-2005: A report to the Scottish Executive Professor Claire Callender London South Bank University Policy Studies Institute 2005
Payments for Social Care to people who would not get it in England Residential Care - £63 Million Nursing Care - £19 Million Personal Care for Home Care Clients - £136 Million All figures 2004-5
BMJ 2004;328:1043-1045 (1 May), doi:10.1136/bmj.328.7447.1043 Is there a north-south divide in social class inequalities in health in Great Britain? Cross sectional study using data from the 2001 census Tim Doran,, Frances Drever,, Margaret Whitehead, In each of the seven social classes, Wales and the North East and North West regions of England had high rates of poor health. There were large social class inequalities in self rated health, with rates of poor health generally increasing from class 1 (higher professional occupations) to class 7 (routine occupations). The size of the health divide varied between regions: the largest rate ratios for routine versus higher professional classes were for Scotland (2.9 for men; 2.8 for women) and London (2.9 for men; 2.4 for women). Women had higher rates of poor health compared to men in the same social class, except in class 6 (semi-routine occupations).
Taken from the Scotsman 2006-01-04Scotland: A nation still divided by poverty and inequality Using NHS data, The Scotsman newspaper compiled an extensive deprivation index, with data for the country's 830 postcode areas, and separated the top and bottom 100 neighbourhoods to show for the first time the scale of inequality in Scotland. The Scotsman has disentangled the data and concentrated on two blocks: "Prime Scotland", which comprises the best 100 neighbourhoods, and "Third Scotland", where life expectancy is closer to the third world. If Prime Scotland were a country, it world have the longest life expectancy in the world. The top international spots are occupied by Iceland (79.0 years), Japan (78.4 years) Sweden (77.9 years), Australia and Canada (both 77.8 years). Third Scotland, by contrast, has an average male life expectancy of only 64.4 years - meaning an eighth of the men in the country can expect to die before the official pension age. This life expectancy is lower than in Bosnia, Lebanon, the Gaza Strip, Iran or North Korea.