Download
1 / 14
140 likes | 154 Vues
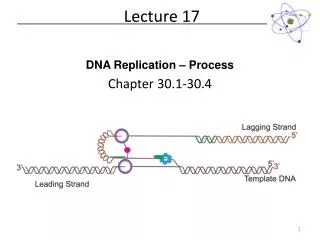
Lecture 17. Spectrophotometry. Emission. source. sample. Absorption. Fluorescence. source. sample. Secondary emission. Monochromator (filter, wavelength selector). Light Source. Detector. Sample. Spectrometer. Data Processing. Monochromator (filter, wavelength selector).

E N D
Lecture 17 Spectrophotometry
Emission source sample Absorption Fluorescence source sample Secondary emission
Monochromator (filter, wavelength selector) Light Source Detector Sample Spectrometer Data Processing
Monochromator (filter, wavelength selector) Light Source Detector Sample Spectrometer Data Processing
Light striking a sample can be 1.reflected2.transmitted3. absorbed 4. scattered
I0 IN <1 Transmittance = I0 I1 I2 We almost never use transmittance! I3 I4 I5 T This is a curve! concentration
Absorbing plate N=CVolume Volume= 1 dx N = C dx dP= N P Incident light Emergent light P P0 P1 dP l 0 dx
Absorbing plate absorbance Incident light Emergent light P0 P1 Sensitivity is the same for any power (P) l 0
Bugert, Lambert and Beer Beer’s law A Straight line! concentration
Least-squares curve fitting. The points (1,2) and (6,5) do not fall exactly on the solid line, but they are too close to the line to show their deviations. The Gaussian curve drawn over the point (3,3) is a schematic indication of the fact that each value of y is normally distributed about the straight line. That is, the most probable value of y will fall on the line, but there is a finite probability of measuring y some distance from the line.
y=kx+b straight line equation k = Slope = y / x b - blank! Let us subtract blank: y-b = Y = kx Y1=kx1 Y2=kx2 One standard
Procedure: • Measure blank. • Measure standard. • Measure unknown. • Subtract blank from standard and from unknown. • Calculate concentration of unknown If you have several (N) standards, do it several (N) times