Download
1 / 24
260 likes | 655 Vues
Aquaculture: A Need for Import Tolerances. Kim R. Young Deputy Director, Division of Compliance Center for Veterinary Medicine US Food & Drug Administration. Presentation. Overview of global aquaculture production Countries which export aquaculture products to the United States

E N D
Aquaculture: A Need for Import Tolerances Kim R. Young Deputy Director, Division of Compliance Center for Veterinary Medicine US Food & Drug Administration
Presentation • Overview of global aquaculture production • Countries which export aquaculture products to the United States • FDA’s concern of global veterinary drugs used in aquaculture
Aquaculture • Definition: “the farming of aquatic organisms, including fish, mollusks, crustaceans, and aquatic plants. Farming implies some form of intervention in the rearing process to enhance production, such as regular stocking, feeding, protection from predators, etc. … “ Source: FAO
Global Aquaculture Production • 32.9 million tonnes (1999) • Increasing at 9.2% per year • One in 4 finfish from aquaculture • One in 3 shrimp from aquaculture • Over 50% of food fish will come from aquaculture in 2007 Source: FAO
World Fisheries Production* Million Tonnes * Wild Caught excludes non-human food production (e.g., fishmeal and oil) Aquaculture excludes plant production (e.g., kelp) Source: FAO
Asia and Aquaculture • Asia produces around 90% of global volume (mainly carps) • Equivalent to around 82% of value • 87.1% by developing countries • 76.8% from Low-Income Food Deficit Countries with per capita income below US$ 1,465. Source: FAO
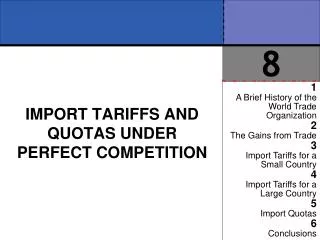
Global Aquaculture Production by Principal Producers, 1998 Rank Producer Production % of Global (millions tonnes) production 1 2 3 4 5 6 China India Japan Philippines Indonesia South Korea 27.07 2.03 1.29 0.95 0.81 0.80 68.7 5.1 3.3 2.4 2.1 2.0 Source: FAO
Global Aquaculture Production by Principal Producers, 1998 Rank Producer Production % of Global (millions tonnes) production 0.58 0.57 0.54 0.48 0.45 0.41 1.5 1.4 1.4 1.2 1.1 1.0 7 8 9 10 11 12 Bangladesh Thailand Vietnam North Korea USA Norway Source: FAO
U.S. Seafood Consumption • Per capital consumption 15.6 lbs. (2000) • Approx. 5 lbs aquaculture (32 %) • Approx. 3.8 lbs imported aquaculture (24 %) Source: NFI
U.S. Top Ten Consumption List Lbs./person 1 Tuna 2 Shrimp 3 Alaska Pollock 4 Salmon 5 Catfish 6 Cod 7 Clams 8 Crabs 9 Flatfish 10 Scallops 3.60 3.20 1.69 1.60 1.23 0.77 0.49 0.46 0.43 0.28 Source: NFI
Salmon Shrimp Mollusks Scallops Mussels Oysters Clams Tilapia Trout Striped Bass Frogs Catfish Crayfish Major Aquaculture Products Exported to the U.S.
Countries Exporting Aquaculture Food Products to the U.S. Argentina Bangladesh Canada Costa Rica Ecuador Finland Greece Honduras India Israel Japan Australia Brazil Chile Denmark El Salvador France Guatemala Hong Kong Indonesia Italy Korea, Republic Austria Burma China, P.R. Dominican Rep. Faroe Islands Germany Guyana Iceland Ireland Jamaica Malaysia
Countries Exporting Aquaculture Food Productsto the U.S.(Continued) Mexico Nicaragua Oman Peru Saudi Arabia South Africa Sweden Tajikistan Trinidad & Tobago Netherlands Nigeria Pakistan Philippines Singapore Spain Switzerland Thailand United Kingdom Venezuela New Zealand Norway Panama Poland Solomon Island Sri Lanka Taiwan Togo Uruguay Vietnam
Amberjack Cod Flounder Halibut Red Sea Bream Sweetfish Carp Eel Grouper Mackerel Sea Perch Yellowtail Aquaculture Species Currently Not Exported to the U.S.
Examples of Drugs in Use in Foreign Aquaculture Acriflavine Amoxicillin Ampicillin Benzocaine Bicozamycin Chloramphenicol Colistin Sulfate Doxycycline Erythromycin Florfenicol Flumequine Fosfomycin Fruluphenicol Furanace Furazolidone
Examples of Drugs in Use in Foreign Aquaculture(Continued) Methylene Blue Miroxisacin Nalidixic acid Nitrofurantoin Novobiocin Oleandomycin Oxolinic acid Oxytetracycline Nifurstyrenate Spiramycin Sulfonamides Thiamphenicol Josamycin Kanaymcin Kitasamycin Lincomycin Malachite Green Methyldihydro- testosterone
Drugs Approved in US Aquaculture • Chorionic gonadotropin • Formalin solution • Tricaine methanesulfonate (MS-222) • Oxytetracycline • Sulfamerazine • Sufadimethoxine/ormetoprim combination
Aquaculture Safety • Seafood HACCP • List Hazards • Unapproved Veterinary Drugs • List Critical Control Points • List Critical Limits • List Monitoring Procedures • List Corrective Actions • List Verification Procedures • Provide for Recordkeeping System
Aquaculture Safety- Enforcement - • Inspections • Foreign Inspections of Processors and Producers • Review of HACCP plan at the importer • Drug testing • Import Alerts • Inadequate HACCP plan/implementation • Drug residues
Aquaculture Safety- Enforcement -(Continued) • Current drug testing • Chloramphenicol in Shrimp • Flumequine in Catfish & Shrimp • Malachite Green in Catfish • Piromidic Acid in Shrimp • Oxolinic Acid in Catfish, Salmon & Shrimp • Oxytetracycline in Shrimp
Database for Drugs and Chemicals used in Foreign Aquaculture • Objectives: • create a database containing information on drug and chemical use in foreign aquaculture, and • perform a human food safety risk assessment for each drug and chemical listed in the database.
Database for Drugs and Chemicals used in Foreign Aquaculture(Continued) • FDA will use the results of this project to: • prioritize the monitoring of drugs and chemicals residues in the edible tissue of imported aquaculture products, • prioritize the development of methods to be used in the monitoring program, • provide a basis for promoting discussion with foreign countries regarding the hazard concerns identified by the risk assessment.
How to Encourage Import Tolerance Applications? • Use Risk Assessments to Develop and Implement Risk Management=Residue Monitoring Program • Develop Residue Methods for High Priority Residues • Efficiently Direct Monitoring of Imports for Residues of Concern • Put Import Alerts in Effect for Countries where Monitoring Shows Residues are Not Controlled • Publicize Monitoring Results
Summary • FDA regulates both drugs for aquaculture & inspection for aquaculture food products • HACCP on Imports and Foreign Inspection Equivalency Discussions Show Wide Disparity in Drugs Permitted to be Used • Potentially hundreds of Import Tolerances are needed for aquaculture species, alone