Download
1 / 12
130 likes | 298 Vues
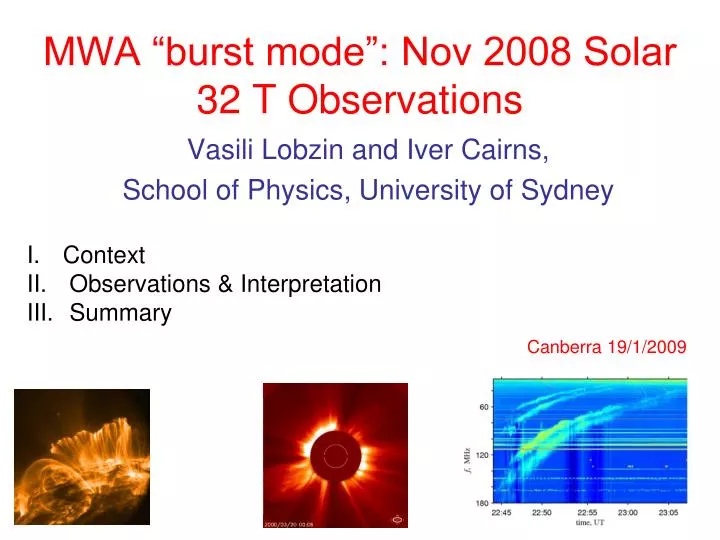
MWA “burst mode”: Nov 2008 Solar 32 T Observations. Context Observations & Interpretation Summary. Vasili Lobzin and Iver Cairns, School of Physics, University of Sydney. Canberra 19/1/2009. I. Context for “Burst Mode” Solar Obs.

E N D
MWA “burst mode”: Nov 2008 Solar 32 T Observations • Context • Observations & Interpretation • Summary Vasili Lobzin and Iver Cairns, School of Physics, University of Sydney Canberra 19/1/2009
I. Context for “Burst Mode” Solar Obs • MWA has strong solar, heliospheric, and ionospheric science objectives • Burst Mode: • 0 – 328 MHz spectra, 256 * 1.28 MHz channels • 1 spectrum per 0.78 μs every 1 ms (0.938 ms) • “engineering” mode, but great for solar science • Highest known cadence, resolution and bandwidth • Imaging? • 17 and 20 November 2008, close to local noon.
II. “Burst Mode” Solar Obs: 20 Nov 2008 • mwadas1,2,&4, each 16 pipes,~ 600 files • ~ 04:00:30 – 04:02:27 (~0.1 s accuracy) • Power spectrum summed over all pipes
“Burst Mode” Solar Obs: 20 Nov 2008 0 f (MHz) 328 04:00:30.8 Time 04:02:26.8 • Vertical, variable signals? Bands of noise? Interference signals? • Any natural signals ….?
Spectra: averaging & background subtraction • (Left) Averaging & (top) background subtraction structure in interference • Vertical signals not solar type IIIs since: • no freq drift & • don’t have Δt ↑ as f ↓ 0 f 328 MHz AVG Time (2 mins)
MWA “vertical signals”: no analogues at Culgoora interference No similar bursts in Culgoora (NSW) data (duration or appearance) noise at MWA 18 0 f 57 328 MHz Time (2 mins) 180 MHz
Culgoora lightning (storm near Sydney) 18 75 Freq 57 180 MHz
MWA “vertical signals”: impulsive local interference Δf ~ 100 – 300 MHz spikes ~ 10 - 3 ns duration. 50 sweep (0.05s) averages, then subtract background periodicity ≈ 3.6 Hz Intensifies with other interference. 0 65 f “signal energy” 328 MHz Time (2 mins) power spectrum Frequency (Hz)
Vertical signals intensify with other interference 0 65 75 Freq 328 MHz
III. Summary • “Burst mode” data should be attractive for solar work (very high cadence, wide bandwidth). • Analysis of 2 mins of 20 Nov 32T data show • Noise & interference bands, • Vertical signals that don’t appear to be natural: • No analogues in Learmonth & Culgoora data; • 3.6 Hz periodicity in energy; • They intensify with other interference; • likely impulsive signals ~ 3 -10 ns in duration. • Desire to remove interference sources for future burst mode observations.