Download
1 / 1
10 likes | 114 Vues
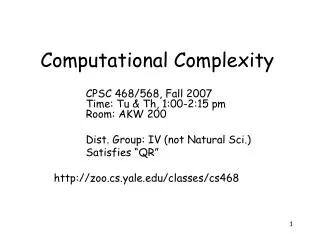
Abstract T31. Optimized measured genotype analysis for genome-wide quantitative trait loci mapping using dense SNP chips Jeffrey R. O’Connell University of Maryland School of Medicine, Baltimore MD 21201. Introduction

E N D
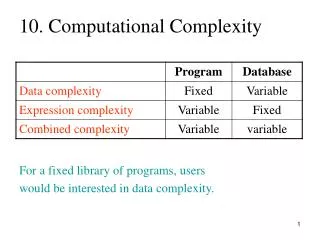
Abstract T31 Optimized measured genotype analysis for genome-wide quantitative trait loci mapping using dense SNP chips Jeffrey R. O’Connell University of Maryland School of Medicine, Baltimore MD 21201 Introduction Advances in genotyping and sequencing technology in the last decade have increased the number of polymorphisms available for genetic analyses in humans from an average of 1000 short tandem repeats (STRs) to over 2 million single nucleotide polymorphisms (SNPs). This technology is now making cost-effective large scale genotyping a reality in many other species. The release of the BovineSNP50 marks the beginning of a new era in marker assisted selection to guide animal breeding of economically important traits in the dairy industry. The analytical and computational challenges posed by genome-wide association analysis (GWAS) with large SNP panels and large numbers of animals will require novel approaches and optimized software. A software package is presented that provides a flexible and powerful tool to meet many of the GWAS challenges. Quantitative Trait Analysis Quantitative trait locus (QTL) mapping is used to identify alleles that contribute to variation of traits of health and economic importance. The Measured Genotype (MG) model is a mixed model for testing association between a quantitative trait and genotype(s) in pedigree data. The MG model treats the genotype of an individual as a measured covariate while incorporating a polygenic component to control residual correlation due to familial relationships, includes genetic data as both fixed and random effects. The focus on this model is the effect size of each genotype rather than the additive variance of each individual. Measured Genotype Model The MG mixed model equation is Yi = m+ bj cij + bm gim + ai + ei, where Yi is the phenotype of the ith individual, cij are environmental covariates, gim is the coded genotype at the mth marker, effect, ai the additive polygenic component and ei is the residual error. The b terms are regression coefficients the measure effect size of the covariate. If we assume multivariate normality: Y~ N(Xb,s2V), then the log likelihood is log L ~ ½log|s2V| - ½(Y-Xb)’V-1(Y-Xb)/s2 where the variance covariance matrix V = h2R + (1-h2)W is a function of the heritability h2, the relationship matrix R (twice kinship matrix) and diagonal matrix of weights W. The mean and covariates are specified in the design matrix X, with genotypes coded as follows: Results Presented are the GWAS results for milk yield under an additive genetic model. The two most significant SNPs have p-values < 1e-80 and are located at positions 236533 and 443936 on chromosome 14 near the major gene DGAT. These results agree with prior expectations given the existing literature on effect size of DGAT and selection pressure on milk yield. • Current Research and Extensions • Major additions being implemented into software include: • Multivariate trait models for correlated phenotypes to improve power to detect SNPs contributing multiple traits • Low-density genotyping panels • Bottom-up regression-model building to identify SNPs that best predict trait • Genomic prediction • Apply SNP estimates to predict genetic merit of animals • Multilocus analysis • Fine-mapping with additional SNPs to determine most likely functional SNP • Haplotype analysis • Increased power if haplotype is better predictor of causal variant than component SNPs • Evaluating the weighted regression and replacing A matrix by genomic matrix estimated from the data • Implementing p • Discussion • The Measured Genotype model is a flexible regression-based analytical tool for genetic analysis of quantitative traits in human and animal pedigrees. The approach is suitable for both GWAS, fine-mapping and genomic selection in large pedigrees. We have presented GWAS results for milk yield that show that DGAT is the most significant locus, thus agreeing with expectation. Additional fine mapping and bioinformatics will be required to discover the causative variants underlying these QTLs. As additional animals are genotyped the power to resolve QTL location will improve. However, as with all dense matrix models there will be limit on the size of the R matrix that will be computationally feasible. • Contact Information • Email: joconnel@medicine.umaryland.edu • Acknowledgements • This work was supported in part by NIH grant U01 HL084756 and by National Research Initiative Grant no. 2007-32205-17883 from the USDA Cooperative State Research, Education, and Extension Service Animal Genome Program. • The author would like to thank USDA AIPL scientists Paul VanRaden and George Wiggans and BFGL scientist Curt Van Tassell for providing mentorship and guidance in bridging from human to animal genetics. • Computational Complexity • The complexity of the MG model for a single SNP is determined by the complexity of the matrix operations in formulas used to iteratively determine the maximum likelihood (ML) estimates of b and s2: • b = X(X’V-1X)-1X’V-1Y, independent of s2 • s2 = 1/n(Y- Xb)’V-1(Y- Xb), where n is the dimension of V • The major complexity is computing V-1 which is O(n3)—that is grows as the cube of the dimension. • Thus the total GWAS complexity is: • (# SNPs) x (# Genetic Models) x (# ML iterations). • As the n increases from tens to hundreds to thousands, the computational time for single SNP increases from seconds to minutes to even hours. • Improving MG Computational Performance • Since the relationship matrix R is positive definite and W is positive definite diagonal, W-1/2RW-1/2= PDP‘ where P is orthogonal and D is the matrix of eigenvalues and P’ is P transpose. Let Q=W1/2P. Thus, we can write the variance-covariance matrix V as • V = h2R + (1-h2)W = h2W1/2PDP‘W1/2 + (1-h2)W1/2PP’W1/2 • = Qh2DQ’ + Q(1-h2)Q • = Q(h2D + (1-h2))Q' • = QM(h2)Q‘, where M(h2) = h2D + (1-h2)I • Thus, V-1 = W-1/2PM-1(h2)P’W-1/2 = SM-1(h2)T. Substituting into the log-likelihood equation and reorganizing matrix multiplications gives • X’V-1X = X’(S M-1T)X = (X’S) M-1(X’T) • Since X’S and X’T have complexity O(pn2) and M-1 has O(n), the complexity of X’V-1X is reduced from O(n3) to O(pn2). • When p<< n (number of SNPs is much smaller than the number of animals), computational performance is significantly improved. If no missing data is assumed then S and T matrices are independent of the SNP, thus requiring a single diagonalization for the GWAS. • Performance of the Algorithm • Data Set • 5425 Holstein animals connected into single 41,000 pedigree • Genotypes from BovineSNP50 chip • ~40K after quality control checks • Missing data imputed using population frequencie • De-regressed phenotype based on PTA and PA • Timing Results • ~ 8 hours to estimate 40K individual SNP effects • The major software package used for MG analysis in human genetics SOLAR (http://www.sfbr.org/solar) cannot handle this data set. Results The next graph shows results excluding major signals on chromosome 14 to provide better resolution of the SNP effects across the genome. Points above the horizontal line are significant at a genome-wide p-value of 0.05 using a Bonferroni correction for multiple testing. Significant signals are present across the genome with chromosomes 3 and 15 showing the two strongest clusters. Genotypes within clusters are generally correlated through linkage and/or linkage disequilibrium, thus do not generally represent independent signals. The results fit the oligogenic mixed model well: a few genes of detectable effect size and many genes of small effect size.