Download
1 / 26
270 likes | 542 Vues
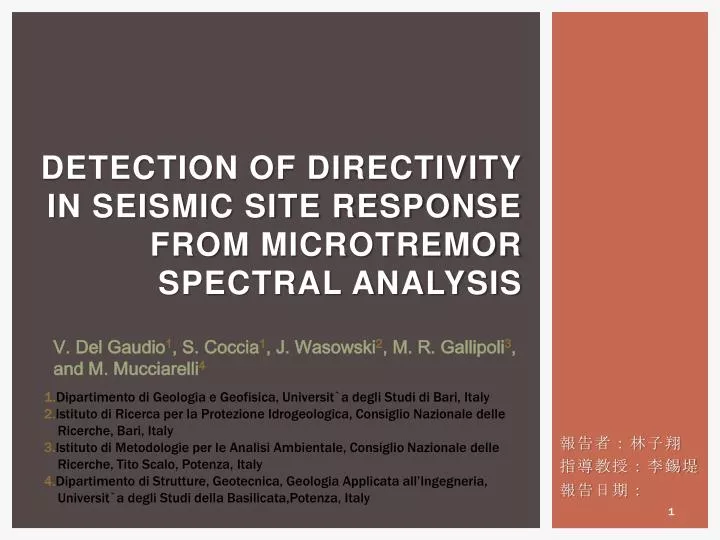
Detection of directivity in seismic site response from microtremor spectral analysis. V. Del Gaudio 1 , S. Coccia 1 , J. Wasowski 2 , M . R. Gallipoli 3 , and M. Mucciarelli 4. 1. Dipartimento di Geologia e Geofisica, Universit`a degli Studi di Bari, Italy

E N D
Detection of directivity in seismic site response from microtremor spectral analysis V. Del Gaudio1, S. Coccia1, J. Wasowski2, M. R. Gallipoli3, and M. Mucciarelli4 1.Dipartimento di Geologia e Geofisica, Universit`a degli Studi di Bari, Italy 2.Istituto di Ricerca per la Protezione Idrogeologica, Consiglio Nazionale delle Ricerche, Bari, Italy 3.Istituto di Metodologie per le Analisi Ambientale, Consiglio Nazionale delle Ricerche, Tito Scalo, Potenza, Italy 4.Dipartimento di Strutture, Geotecnica, Geologia Applicata all’Ingegneria, Universit`a degli Studi della Basilicata,Potenza, Italy 報告者:林子翔 指導教授:李錫堤 報告日期:06/09
Research Motivation InTRODUCTION Recent observations have shown that slope response to seismic shaking can be characterized by directional variations of a factor of 2–3 or larger, with maxima oriented along local topography features (e.g. maximum slope direction). This phenomenon appears influenced by slope material properties and has occasionally been detected on landslide-prone slopes, where a down-slope directed amplification could enhance susceptibility to seismically-induced landsliding. We tested the applicability of a method commonly used to evaluate site resonance properties (Horizontal to Vertical Noise Ratio – HVNR or Nakamura’s method) as reconnaissance technique for the identification of site response directivity.
Research Motivation Previous WORK The analysis presented by Del Gaudio and Wasowski (2007) suggests that these phenomena are not caused by a purely topographic effect. Indeed, a fundamental role seems to be played by anisotropies in slope material properties, which, in different settings, can be either induced by factors controlling also the topographic relief (e.g. tectonics) or directly controlled by the topography (e.g. as effect of gravity-driven mass movements). However, until now, the limited amount of observational data has not allowed a thorough understanding of factors controlling directional amplification and the definition of practical recognition criteria.
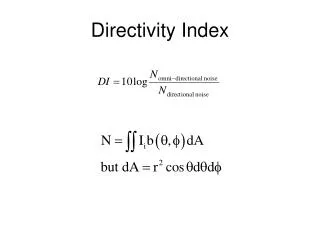
Research Method site effect evaluations site effect evaluations byreference site methodand non-reference sitemethod HSS=Horizontal Spectrum ofSedimentary site Reference site method HSR=Horizontal Spectrumof Reference site HNS=Horizontal Noise of Sedimentary site HNR=Horizontal Noise of Reference site Borcherdt(1970) HNS=Horizontal Noise of Sedimentary site Non-reference sitemethod VNS=Vertical Noise of Sedimentary site HSS=Horizontal Spectrum ofSedimentary site VSS=Vertical Spectrum ofSedimentary site Nakamura(1989) Lermo and Chávez-García (1993)
Research Method ABOUT HVNR The HVNR technique, despite its somewhat unclear theoretical bases (see Bonnefoy-Claudet et al., 2006a), has been diffusely applied in microzonation studies, mainly because peaks in the H/V spectral ratios have proved to be an effective indicator of the resonance frequency of low-impedance surface layers. The technique remains popular even though the reliability of the associated estimate of the amplification factor is deemed questionable (Bonnefoy-Claudet et al., 2006b).
ROMA Study Area Orfento and Orta river valleys • high relief • active river erosion • strong permeability contrasts between different lithologies • abundant rainfall • close to active seismogenicstructures • a case triggered by an event that was quite far away (with epicentral distance more than 100 km)
Study Area Etna ACCELEROMETRIC NETWORK Tromino = accelerometricstations. = microseismic noise measurements.
Study Area GEOLOGICPROFILES Car1 Car5 Car2 5 Car3 Car4
Study Area HVNR measurements
Data Analysis CAR1vs CAR2 &CAR4vs CAR3
Data Analysis Polar diagrams of normalized Arias intensity Max,0.90;min,0.83 Max,0.99,260° Min,0.55,170° Max,0.96,290° min,0.33,200° Max,0.89;min,0.59
Data Analysis Polar diagrams of HVSR Horizontal - to -Vertical Spectral Ratio (HVSR) from seismic “weak motion” data until 2008
Data Analysis Polar diagrams of HVNR Tromino Horizontal - to -Vertical NoiseRatio (HVNR) from microtremor recordings
HVSRVSHVNR Data Analysis ↓以 MmQ > 1.5 作為門檻值了解有無方向性 HVM: at the frequency the maximum spectral ratio of H/V HVm: at the frequency the minimum spectral ratio of H/V
HVSRVSHVNR Data Analysis
Data Analysis Polar diagrams of HVNR Etna Horizontal - to -Vertical NoiseRatio (HVNR) from microtremor recordings 13.1 14.7
Data Analysis Influence of instrumental properties Etna/Tromino 13
Data Analysis Polar diagrams of HVNR
HVSRVSHVNR Data Analysis 2.4905.31.7 HVM: at the frequency the maximum spectral ratio of H/V HVm: at the frequency the minimum spectral ratio of H/V
Discussion and Conclusions Provisional criteria for site response directivity identification from HVNR • Peaks with significant H/V spectral ratio values (not less than 2) having a significant directivity (maximum/minimum quotient larger than 1.5) should be identified in the azimuthal distribution of HVNR values • If only one peak with a significant directivity is found, repeated measurements have to be performed at different hours and week days, to rule out the possibility that the single directional maximum is due to a source of polarisednoise and thus may not reflect site properties • Major directional peaks should have similar directions (within an azimuth interval of 20–30); otherwise differently oriented pronounced peaks could reflect the coexistence of different sources of polarised noise at different azimuths.
Discussion and Conclusions • several directional spectral peaks can be found atdifferent frequencies along similar directions. • The calculation of horizontal to verticalspectral ratios derived from seismic events (HVSR) or microtremormeasurements (HVNR) can provide quite variablepeak frequencies in relation to the signal-to-noise ratiocharacterizing recordings in different frequency bands. • under the conditionsof site response complexity typical of slopes withboth topographic and lithostratigraphic amplification, HVNRand HVSR measurements alone cannot provide a completeand reliable identification of resonance frequencies and amplificationfactors.
波的傳導,根據Snell’s Law,在不同介質中情況 此為討論建立於平行層狀構造上,但事實上地震波所經過的地球內部應是呈現球狀層狀構造。 i V V’ I’ V’>V
回顧研究方向性文獻 場址效應: 方向性(directivity): 提到方向性與地形無關: Vidale et al.(1991) at Los Angeles Bonamassa and Vidale (1991) at California (認為是非均質地質條件造成) 提到方向性與地形有關: Squdich et al.(1996) at California(沿著最大坡面有方向性) 與山崩構造有關: Xu et al.(1996)(透過模型發現沿著山崩滑脫面S波產生偏振現象) 其他: Rial(1996)(波被滯留在山波內低速物質而產生放大) Vahdani and Wikstrom(2002)(地震波通過基盤時產生傾斜) Gallipoli and Mucciarelli(2007)(HVSR峰值方向與滑移方向相同)