Download
1 / 61
610 likes | 713 Vues
Active Transportation and Demand Management Operational Concept Workshop #2. February 7, 2012 Washington, DC 20590. Agenda. 8:30 AM Objectives & FHWA Program Review 8:45 AM Introductions 9:30 AM Operational Philosophy 10:00 AM Baseline for Active Management 10:30 AM Break

E N D
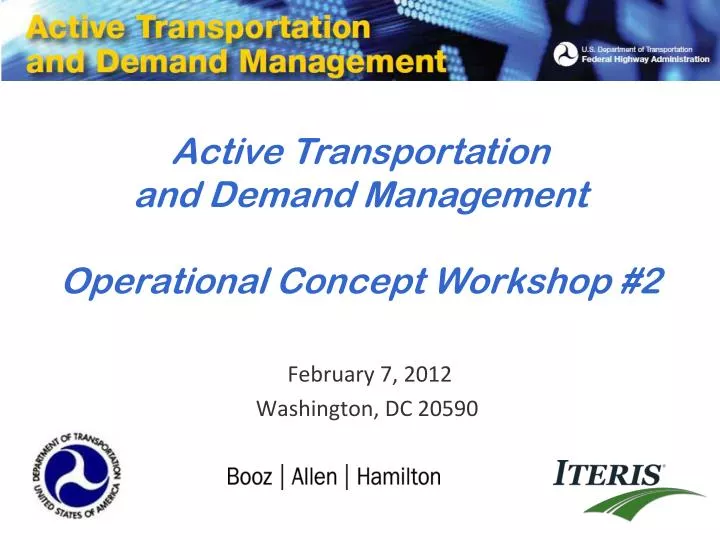
Active Transportation and Demand Management Operational Concept Workshop #2 February 7, 2012 Washington, DC 20590
Agenda 8:30 AM Objectives & FHWA Program Review 8:45 AM Introductions 9:30 AM Operational Philosophy 10:00 AM Baseline for Active Management 10:30 AM Break 10:45 AM Operational Scenario #1 Noon Lunch 1:30 PM Operational Scenario Breakouts – local & online 2:15 PM Present breakout results 2:45 PM Break 3:00 PM Summary 4:00 PM Adjourn
Workshop Objectives Establish a common understanding of active management Review the active management approach to traffic and demand management. Provide a clear understanding of active management’s added value to the transportation community, based on the use of management scenarios that describe how active management may be applied on a day-to-day basis.
Research Tool Development And Guidance Outreach and Training FHWA ATDM Program Stakeholder Engagement Program Management
Motivation for FHWA ATDM Program • Desirable Policy Outcomes • Reliability • Mobility • Safety • Sustainability • Customer expectations and choice • Accountability for performance • Domestic Experience • Successful ATM deployment, ICM development, and MTD adoption • Seattle, Minneapolis, Miami, San Diego, Dallas • International Experience • Successful ATM and MTD integration • United Kingdom, Netherlands, Germany
Active Management Focus on real-time dynamic management of system
Supply and Demand Management of supply and demand
Structure of Workshop • Present Operational Philosophy • Establish the Baseline for Active Management • Present and Apply the Operational Concept • Introductory Scenario • Breakout group discussion • Link to future activities / INFLO
Agenda 8:30 AM Objectives & FHWA Program Review 8:45 AM Introductions 9:30 AM Operational Philosophy 10:00 AM Baseline for Active Management 10:30 AM Break 10:45 AM Operational Scenario #1 Noon Lunch 1:30 PM Operational Scenario Breakouts – local & online 2:15 PM Present breakout results 2:45 PM Break 3:00 PM Summary 4:00 PM Adjourn
Introductions Name Organization Role
Agenda 8:30 AM Objectives & FHWA Program Review 8:45 AM Introductions 9:30 AM Operational Philosophy 10:00 AM Baseline for Active Management 10:30 AM Break 10:45 AM Operational Scenario #1 Noon Lunch 1:30 PM Operational Scenario Breakouts – local & online 2:15 PM Present breakout results 2:45 PM Break 3:00 PM Summary 4:00 PM Adjourn
ATDM Foundational Research Task • Develop framework for ATDM as basis for program conceptual and test bed development • Objectives • Support development of ATDM program efforts • Support development of ATDM analysis and modeling framework
Relationship of Activities – ATDM FR Draft Operational Concept User Needs Refined Operational Concept Operational Scenarios Select 4 Deployment Packages As Basis for Test Bed Concept Detailed ConOps Development For 4 Deployment Packages AMS Analysis and Capability Assessment ATDM Test Bed Needs & Benchmarks
Terminology (for today) Active Proactive Dynamic Integrated Performance-Driven Trip Chain
What is “Active”? 1: characterized by action rather than by contemplation or speculation 2: producing or involving action or movement 3: asserting that the person or thing represented by the grammatical subject performs the action represented by the verb < in “he hits the ball” is > : expressing action as distinct from mere existence or state 4: quick in physical movement : lively 5: marked by vigorous activity : busy <the stock market was > 6: requiring vigorous action or exertion < sports> 7: having practical operation or results : effective <an law> 8:disposed to action : energetic <took an interest> : engaged in an action or activity <an club member> : currently erupting or likely to erupt — compare dormant 2a, extinct 1b : characterized by emission of large amounts of electromagnetic energy <an galactic nucleus> 9: engaged in full-time service especially in the armed forces < duty> 10 marked by present operation, transaction, movement, or use <an account> 11: capable of acting or reacting : reacting readily < nitrogen> < ingredients> : tending to progress or to cause degeneration < tuberculosis> : capable of controlling voltages or currents : requiring the expenditure of energy < calcium ion uptake> : functioning by the emission of radiant energy or sound <radar is an sensor> 12: still eligible to win the pot in poker 13: moving down the line : visiting in the set —used of couples in contredanses or square dances
What Does “Active” Mean from a Transportation Perspective? Traffic Impact Event Occurrence Reactive Pro -active Predictive • Active Management is a real-time concept that contains three elements: • Predictive element using historical and current condition information to prevent specific situations and resultant impacts • Proactive element addressing immediate situation to alleviate impacts before they occur • Reactive element to address impacts that have already occurred
The Balance between Static and Dynamic Operational Functionality Static Dynamic Denotes fixed or stationary condition. (e.g., static signs, fixed-time signal operations, time-of-day shoulder use) Denotes energy or effective action caused by motivation (e.g., adaptive signal timings, congestion-triggered hard shoulder running, fully-variable speed limits)
Active Management = Proactive + Dynamic • Active has management and operational components • Proactive – anticipate or pre-empt events that negatively impact system • Dynamic – use real-time information and commands to execute operational actions
Integration and ATDM • Operational integration • Multi-agency information sharing and cross-network coordination and operation to facilitate management of the total capacity and demand of the corridor. • Institutional integration • Interagency coordination and collaboration, multi-agency interoperability, distributed agency roles • Technical integration • Interagency communication links, data sharing, immediate view and feedback on operating strategies
ATDM is Based on Performance Objectives • Travel time • Travel time reliability • Queue clearance time • Crash rates • GHG / carbon footprint • Occupancy / vehicle • Enforcement % • Capacity utilization • System revenues • KPI’s (should be quantifiable and measurable in real-time)
The Trip Chain Destination choice Time of day choice Mode choice Route Choice Lane / facility Choice
Summary of ATDM Operational Philosophy • ATDM is ideally • Active (both proactive and dynamic) • Integrated (technically, institutionally and operationally) • Driven by Performance Objectives • Management of demand and traffic flow • A way of thinking, not merely a series of projects / technologies / applications
Agenda 8:30 AM Objectives & FHWA Program Review 8:45 AM Introductions 9:30 AM Operational Philosophy 10:00 AM Baseline for Active Management 10:30 AM Break 10:45 AM Operational Scenario #1 Noon Lunch 1:30 PM Operational Scenario Breakouts – local & online 2:15 PM Present breakout results 2:45 PM Break 3:00 PM Summary 4:00 PM Adjourn
Baseline for Active Management How “Active” Are You Today? Defining the Baseline vs. the Ultimate Capability Maturity
Capability Maturity Levels (“Generic CMM”) (NASA, public domain)
CMM Applied to Freeway Lane Management Fully Dynamic And Proactive Static And Reactive 1 2 3 4 5 Level of Operational Response and Interagency Coordination
CMM Applied to Demand Management Fully Dynamic And Proactive Static And Reactive 1 2 3 4 5 Level of Operational Response and Interagency Coordination
CMM Applied to Traveler Information Fully Dynamic And Proactive Static And Reactive 1 2 3 4 5 Level of Operational Response and Interagency Coordination
The ATDM Baseline • We are likely somewhere “in the middle” relative to most operational activities • Some agencies / regions are farther along than others • Management activities are often more proactive than the systems / technology tools that are used • Truly dynamic operations requires performance information and predictive capabilities • The baseline helps identify where ATDM initiatives need to “begin”
The ATDM Operational Concept Relationship to Trip Chain Supply and Demand Strategies Influence vs. Control The ATDM “Ecosystem” Sample Scenario
The Trip Chain Destination choice Time of day choice Mode choice Route Choice Lane / facility Choice
Manage Existing Capacity (Supply) and Travel Demand Supply side measures seek to improve system operation by directly changing available transportation supply. Supply Side Management Demand side measures seek to improve system operations by influencing travel demand. Demand Side Management
The ATDM “Ecosystem” A common environment which enables active management of transportation Consider institutional layer of US National ITS Architecture
The ATDM “Ecosystem” Who: Hosted by one or more entities (DOT, MPO, etc.) What: Real-time and archivde user and facility data, decision support, performance and trend analysis System Data and Services Who: State, Local DOT, Transit Authority, Toll Authority, MPO What: Freeway, arterial, transit facility, integrated corridor Agency / Facility Who: Information, Transportation Service Providers What: Information Devices, Applications, Clearinghouses Private Partners (for-profit and non-profit Servces) Who: Rideshare organization What: Ridematching services for end-to-end journeys Who: Travelers (pretrip), drivers, riders Where: Home, public space, private vehicle, transit vehicle, rideshare vehicle User / Traveler
Base Functions Within Each ATDM-OC Layer System Data and Services • Manage Transportation Supply – Roads, transit, parking • Active traffic management • Managed Lanes (HOV, HOT, etc.) • Road, parking, transit pricing strategies - predictive, proactive, anticipatory, reactive • Execute operational policies / strategies – commuter, freight, event, GHG • Manage Incidents • Collect facility data Agency / Facility Private Partners (for-profit and non-profit Servces) • Provide information • Influence Travel Demand • Comparative travel time information • Travel options • Assist in developing end-to-end trips (cost, time, GHG criteria) – Best routes / modes • Make choices – Destination, Time-of-Day, Mode, Route, Lane/Facility • Provide data to system, agency / facility and private partners • Travel choices • Vehicle data / status • Payment User / Traveler Relational Streaming Data Collection – Current Conditions Historic Data Archive Strategy Database Predictive Model / Decision Support Real-Time Performance Analytics Module
Agenda 8:30 AM Objectives & FHWA Program Review 8:45 AM Introductions 9:30 AM Operational Philosophy 10:00 AM Baseline for Active Management 10:30 AM Break 10:45 AM Operational Scenario #1 Noon Lunch 1:30 PM Operational Scenario Breakouts – local & online 2:15 PM Present breakout results 2:45 PM Break 3:00 PM Summary 4:00 PM Adjourn
Applying the ATDM-OC to Operations • Development of Scenarios • Think strategically as a policymaker • Think tactically as an operator • Think of what you would want and do as a traveler
25k ppd 150k ADT (no HOV facility) 50k ADT, 4k ppd on express bus 10k ppd 45k ppd 115k ADT 200k ADT (Express Toll Lanes Carry 30k ADT) Truck %: Corridor 1 20% All Other 5% TOLL BR. 35k ppd 170k ADT (6k in HOV lane) ppd = passengers/day ADT = average daily traffic (corridor)
Stakeholders State DOT (freeways and HOV, signals at fwy interchanges) Centre City Streets and Sanitation Department (city signals) County DPW (suburban signals) Tolling Authority (toll bridge, tolling on Corridor 4 express lanes) Green Riders (rideshare / carpool non-profit) Port Authority (water taxis and intermodal / port facilities) Bus Transit Authority (all buses) Commuter Rail Authority (all trains) Sports and Convention Authority (Blueskins, Pandas, Ice Sox) Local Police and Fire Departments State Police (freeways and toll br only)
Steps to Developing the Scenario • Define goals in terms of performance measures • Determine “ATDM Actions” based on goals • Identify stakeholders and information-sharing needs • Address operational constraints • use real experience / knowledge from your agency • Identify information processing needs
Sample Scenario:Recurring congestion • Measurable Goals • Reduce travel time variability to less than 10% of average travel time • Reduce vehicle demand in each corridor by 4000 vehicles / day • Reduce average carbon footprint by 10% per traveler per day based on average CF of 1.5 tons/day/person • Eliminate rear-end crashes • Eliminate secondary crashes
Examples of “ATDM Actions” (Can You Think of Others?)
Goals vs. Actions • Reduce vehicle demand in each corridor by 4000 vpd • Reduce travel time variability to less than 10% of average travel time • Reduce average carbon footprint by 10% per traveler per day Eliminate Rear-end Crashes Eliminate Secondary Crashes ACTIONS
Stakeholders / Information Needs ACTIONS State DOT Centre City Streets and Sanitation Dept County DPW Tolling Authority Green Riders Port Authority Bus Transit Authority Commuter Rail Authority Sports and Convention Authority Local Police and Fire Departments State Police
Outputs Inputs System Concept • State DOT • Traffic info • Device status • Parking status • Centre City Streets and Sanitation Dept • Traffic Info • Device status • County DPW • Traffic Info • Device status • Tolling Authority • Toll tag reads • Traffic info • Green Riders • TDM customer hits / assistance • Port Authority • Veh Status/location • Parking status • Ridership • Bus Transit Authority • Status/location • Parking status • Ridership • Commuter Rail Authority • Status/location • Parking status • Ridership • Sports and Convention Authority • Parking status • State Police • Enforcement data Destination Choice System Actions • Parking availability • Route status • Accessibility by transit • Accessibility by rideshare Time-of-Day Choice • Parking availability/price • Traffic conditions • Toll rates • Comparative travel times • Accessibility by transit • Accessibility by rideshare Mode Choice • Parking availability/price • Traffic conditions • Toll rates • Comparative travel times • Accessibility by transit • Accessibility by rideshare Route Choice • Traffic conditions, TT’s on each route • Toll rates • Ramp meter rate restrictions at specific ramps Lane/Facility Choice • Express lane toll rates • Lane status (HOV, shoulder, etc.) • Current speed limits by lane • Queue warning info
Agenda 8:30 AM Objectives & FHWA Program Review 8:45 AM Introductions 9:30 AM Operational Philosophy 10:00 AM Baseline for Active Management 10:30 AM Break 10:45 AM Operational Scenario #1 Noon Lunch 1:30 PM Operational Scenario Breakouts – local & online 2:15 PM Present breakout results 2:45 PM Break 3:00 PM Summary 4:00 PM Adjourn
Scenario Summary Up to three breakout group scenarios Get your assignments Follow the process presented in AM session Address institutional issues Presentation
Agenda 8:30 AM Objectives & FHWA Program Review 8:45 AM Introductions 9:30 AM Operational Philosophy 10:00 AM Baseline for Active Management 10:30 AM Break 10:45 AM Operational Scenario #1 Noon Lunch 1:30 PM Operational Scenario Breakouts – local & online 2:15 PM Present breakout results 2:45 PM Break 3:00 PM Summary 4:00 PM Adjourn