Download
1 / 20
200 likes | 327 Vues
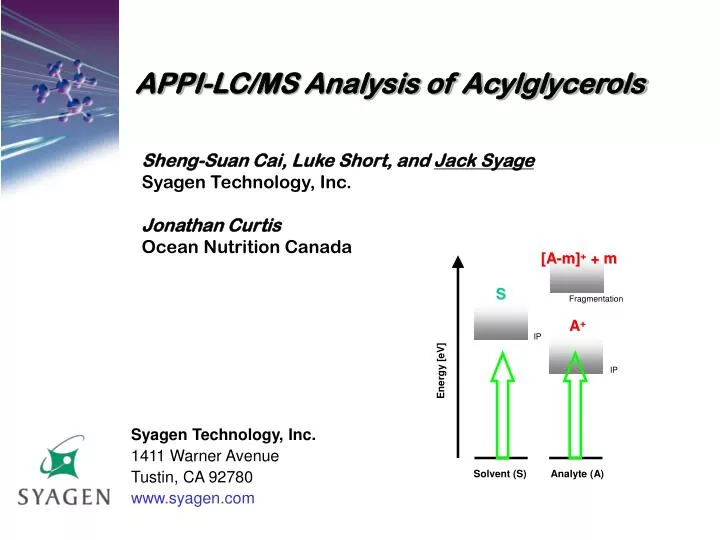
APPI-LC/MS Analysis of Acylglycerols. Sheng-Suan Cai, Luke Short, and Jack Syage Syagen Technology, Inc. Jonathan Curtis Ocean Nutrition Canada. Syagen Technology, Inc. 1411 Warner Avenue Tustin, CA 92780 www.syagen.com. Photoionization. [A-m] + + m. S. Fragmentation. A +. IP.

E N D
APPI-LC/MS Analysis of Acylglycerols Sheng-Suan Cai, Luke Short, and Jack Syage Syagen Technology, Inc. Jonathan Curtis Ocean Nutrition Canada Syagen Technology, Inc. 1411 Warner Avenue Tustin, CA 92780 www.syagen.com
Photoionization [A-m]+ + m S Fragmentation A+ IP Benefits of Photoionization • Ionizes wide range of compounds (e.g., non-polars, electronegative cpds, etc.) • Predominantly parent ion signal • Minimum fragmentation • Minimum solvent signal • Minimum ion suppression • Signal linear with concentration IP Energy [eV] Solvent (S) Analyte (A)
LC eluent / injection probe cone ~ ~ ~ ~ ~ ~ ~ VUV lamp APPI Source pump to MS
Direct APPI vs. Dopant-assisted APPI Direct APPI M + hv M+ + e- M+ + S MH+ + S[-H] Dopant APPI D + hv D+ + e- D+ + M MH+ + D[-H] D+ + M M+ + D Analyte molecule M is ionized to a molecular radical ion M+. (If analyte ionization potential is below photon energy) In the presence of protic solvents, M+ may abstract a hydrogen atom to form MH+. A photoionizable dopant is delivered in large concentration to yield many D+ ions. D+ ionizes analyte M by proton or electron transfer. This is PI-initiated APCI.
Published APPI Literature Over 1000 APPI sources in users hands since introduction in 2001 Bibliography available on www.syagen.com
Objectives • Developed improved method relative to conventional methods • GC or GC/MS requires tedious sample prep and analyte derivatization • Conventional LC (i.e., with UV or ELSD) lacks sensitivity and specificity • Difficulties in analyzing nonpolar lipids by reversed phase LC/MS due to low solubility of analytes in reversed phase solvent systems (i.e., MeOH:H2O or CH3CN:H2O) • Normal phase LC/MS may be better choice • To investigate the advantage of using APPI over APCI and ESI for analysis of nonpolar lipids by comparing • Mass spectra • Dynamic linear range • Sensitivity
Selected Target Analytes • Four individual non-polar lipid standards were tested • EPA and EPA methyl ester (fatty acid group) • Monoarachidin (saturated monoglyceride, C20:0) • Diarachidin (saturated diglyceride, C20:0) • Trielaidin (monounsaturated triglyceride, C18:1) Trielaidin EPA S.- S. Cai and J. A. Syage, Anal. Chem.78, 1191-1199 (2006). S.- S. Cai and J. A. Syage, J. Chromatogr. A, 1110, 15-26 (2006).
9.44e5 ESI+ APPI+ 1.71e5 [M+H]+ [M+Na]+ [M+H]+ [M+NH4]+ 9.36e5 [M+H]+ 5.99e5 [M+H]+ APCI+ ESI+ [M+Na]+ EPA Methyl Ester (MW = 316) Mass Spectra APPI and APCI mobile phase was hexane, ESI mobile phase was 1:1 isooctane/IPA without or with 10 mM ammonium formate
Comparison of APPI, APCI, and ESI Monoarachidin Linearity Plots. Mobile phase: 1:1 isooctane/IPA (APPI & APCI). 10:15:1 isooctane/IPA/water with 15.4 mM sodium acetate (ESI sodium adduct) and 1:1 isooctane:IPA with 10 mM ammonium formate (ESI ammonium adduct).
Peak Smoothness, Area Count and S/N Ratio EPA Methyl Ester [M+H]+, 1000 pg APPI+ Area=983 S/N Ratio = 138 APCI+ Area = 445 S/N Ratio = 46 ESI+ Area = 1718 S/N Ratio = 35 High area count does not necessarily mean high S/N ratio
Monoarachidin 40 ESI Linear up to only 5 ng ESI Linear up to only 10 ng Diarachidin ESI Signal Nonlinear 30 120 100 Day2 DL (pg) 80 20 DL (pg) [M+Na]+ 60 [M+NH4]+ [M+NH4]+ 40 Day1 20 10 [M+NH4]+ [M+Na]+ 0 APPI+ APCI+ ESI+ 0 APPI+ APCI+ ESI+ ESI+ ESI+ [M+NH4]+ Comparison of Detection Limits • ESI [M+Na]+ signal unstable, • NaOAc causes source fouling, • ESI [M+NH4]+ poor linearity, nonlinear or extremely narrow linear range
LLO, C18:2/C18:2/C18:1 LnLnLn, C18:3/C18:3/C18:3 SSO, C18:0/C18:0/C18:1 LLL, C18:2/C18:2/C18:2 SSS, C18:0/C18:0/C18:0 OOO, C18:1/C18:1/C18:1 Chemical Structures of TAG Analytes
[M+H]+ [M-C18:0]+ [M-C18:2]+ [M+Na]+ [M-C18:1]+ SSS, C18:0/C18:0/C18:0 LLO, C18:2/C18:2/C18:1 [M+H]+ [M-C18:1]+ [M-C18:0]+ [M-C18:2]+ [M+Na]+ LLL, C18:2/C18:2/C18:2 SSO, C18:0/C18:0/C18:1 [M-C18:1]+ [M+H]+ [M+Na]+ [M-C18:3]+ [M+H]+ OOO, C18:1/C18:1/C18:1 LnLnLn, C18:3/C18:3/C18:3 APPI Full Scan Mass Spectra of TAGs As degree of unsaturation increases, [M+H]+ intensity increases
Mobile Phase B Mobile Phase A MeOHorCH3CN IPAorCH2Cl2orCHCl3or …… StrongSolvent Strength Weak Solvent Strength Good solubility Poor solubility Strategies for Establishments of NA-RP Mobile Phases by Gradient Elution Six possible combinations as binary mobile phase: MeOH:IPA, MeOH: CH2Cl2, MeOH:CHCl3 CH3CN:IPA, CH3CN:CH2Cl2, CH3CN:CHCl3
Nonaqueous RP-LC Separations of TAGs LnLnLn LLL LLO OOO SSO SSS MeOH:IPA, 9:1 for 0.25 min, linear gradient to 4:6 in 4 min and hold No dopant CH3CN:IPA, 9:1 for 0.25 min, linear gradient to 3:7 in 4 min and hold Dopant acetone MeOH:CHCl3, 9:1 for 0.25 min, linear gradient to 6:4 in 4 min and hold Dopant acetone CH3CN:CHCl3, 9:1 for 0.25 min, linear gradient to 5:5 in 4 min and hold Dopant acetone MeOH:CH2Cl2, 9:1 for 0.25 min, linear gradient to 6:4 in 4 min and hold Dopant acetone CH3CN:CH2Cl2, 9:1 for 0.25 min, linear gradient to 5:5 in 4 min and hold Dopant acetone Waters ZQ APPI-LC/MS. Gemini C18 Column, 150 x 2 mm. Mobile phase flow rate 0.2 mL/min, dopant flow rate 0.04 mL/min. 10 ng each.
Mobile Phase: MeOH/IPA Peak Area Toluene Acetone No Dopant S/N Ratio Dopants do not enhance overall sensitivity
Toluene Acetone No dopant Mobile Phase: MeOH/CHCl3 Peak Area S/N Ratio Dopants enhance performance and acetone wins due to lower baseline noise than toluene
Summary and Conclusions • Triacylglycerols in free acid and methyl ester forms in standards and in fish oils were studied by LC/MS using APPI, APCI, and ESI • APPI and APCI offer comparable linear range (i.e., 4-5 decades) • APPI is 2-4x more sensitive than APCI and much more sensitive than ESI w/o mobile phase additives. • ESI sensitivity dramatically enhanced by mobile phase modifiers, but at much reduced linear range. • Flow injection LODs <10 pg, and overall on-column LODs are 25 – 200 pg for a wide range of solvent conditions • Use “APPI-Friendly” solvents such as IPA or MeOH for high sensitivity w/o dopants • Use CH3CN or CHCl3 for lower column backpressure and better resolution, but dopants needed • Acetone outperforms toluene as a dopant by not increasing and sometimes even suppressing baseline noise • We acknowledge partial funding from NIH
Estimated On-Column Limits of Detection MeOH/IPA CH3CN/IPA MeOH/CHCl3 CH3CN/CHCl3 MeOH/CH2Cl2 CH3CN/CH2Cl2 No dopant Acetone Acetone Acetone Acetone Acetone Most of LODs fall below 200 pg levels. Estimated from injections of 1 ng/µL mixed standard with 10 µL injection volume. LODs equivalent to the amount at S/N = 3.