Download
1 / 1
30 likes | 189 Vues
Introduction Prevalence and increasing frequency of diabetes underscore need for screening Subject studies (see adjacent poster) demonstrate that NIR & fluorescence can noninvasively classify diabetes patients with performance comparable to FPG

E N D
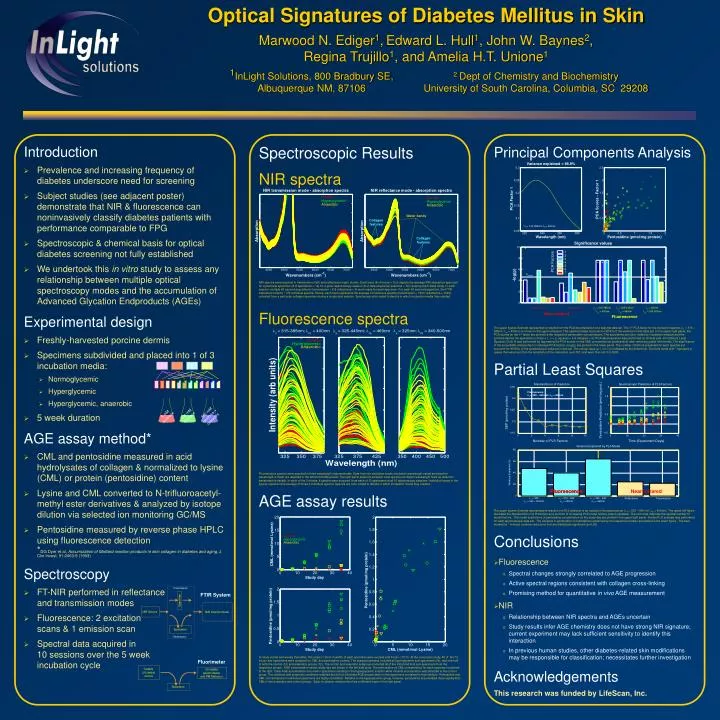
Introduction Prevalence and increasing frequency of diabetes underscore need for screening Subject studies (see adjacent poster) demonstrate that NIR & fluorescence can noninvasively classify diabetes patients with performance comparable to FPG Spectroscopic & chemical basis for optical diabetes screening not fully established We undertook this in vitro study to assess any relationship between multiple optical spectroscopy modes and the accumulation of Advanced Glycation Endproducts (AGEs) Experimental design Freshly-harvested porcine dermis Specimens subdivided and placed into 1 of 3 incubation media: Normoglycemic Hyperglycemic Hyperglycemic, anaerobic 5 week duration AGE assay method* CML and pentosidine measured in acid hydrolysates of collagen & normalized to lysine (CML) or protein (pentosidine) content Lysine and CML converted to N-trifluoroacetyl-methyl ester derivatives & analyzed by isotope dilution via selected ion monitoring GC/MS Pentosidine measured by reverse phase HPLC using fluorescence detection *DG Dyer et al, Accumulation of Maillard reaction products in skin collagen in diabetes and aging, J Clin Invest, 91:2463-9 (1993) Spectroscopy FT-NIR performed in reflectance and transmission modes Fluorescence: 2 excitation scans & 1 emission scan Spectral data acquired in 10 sessions over the 5 week incubation cycle Variance explained = 98.9% 0.3 2.5 0.25 2 0.2 1.5 PCA Factor 1 PCA Scores - Factor 1 0.15 1 0.1 0.5 l lm x= 315-385nm; = 400nm 0.05 0 320 340 360 380 0 0.5 1 1.5 2 Wavelength (nm) Pentosidine (pmol/mg protein) Spectroscopic Prediction (4 PLS Factors) Standard Error of Prediction 0.35 2 Fluorescence x = 325 – 445 nm; m = 460nm 1.5 0.3 1 Pentosidine Prediction (pmol/mg prot.) 0.25 SEP (pmol/mg protein) 0.5 0.2 0 0.15 -0.5 0 2 4 6 8 10 0 10 20 30 40 Number of PLS Factors Time (Experiment Days) Variance Explained by PLS Model 80 * 60 * * Variance Explained (%) 40 20 Fluorescence Fluorescence Near Infrared 0 x = 325 m = 340 – 500nm x = 315 - 385 m = 400nm x = 325 - 445 m = 460nm Reflectance Transmission Optical Signatures of Diabetes Mellitus in Skin Marwood N. Ediger1,Edward L. Hull1, John W. Baynes2, Regina Trujillo1, and Amelia H.T. Unione1 1InLight Solutions, 800 Bradbury SE, Albuquerque NM, 87106 2 Dept of Chemistry and BiochemistryUniversity of South Carolina, Columbia, SC 29208 Spectroscopic Results NIR spectra NIR spectra were acquired in transmission (left) and reflectance (right) modes. Each trace (# of traces = 120) depicts the average NIR absorption spectrum for a particular specimen (# of specimens = 12) for a given spectroscopy session (# of data acquisition sessions = 10) covering the 5 week study. In each session, multiple 60-second acquisitions (transmission = 8 & reflectance = 6) were made for each specimen. For each 60 second acquisition, the FTIR instrument collects ~170 individual spectra. Hence, each trace represents the average of numerous spectra (transmission = 1360; reflectance = 1020) collected from a particular collagen specimen during a single data session. Spectra are color coded to denote in which incubation media they resided. Fluorescence spectra Fluorescence spectra were acquired in three wavelength regions/modes. Data from two excitation scans (excitation wavelength varied as detection wavelength is fixed) are depicted in the left and middle panels. The right panel presents emission scan spectra (excitation wavelength fixed as detection wavelength is varied). In each of the 3 modes, 4 spectra were acquired from each of 12 specimens at all 10 spectroscopy sessions. Individual traces in the figures represent the average of those 4 individual spectra. Spectra are color coded to denote in which incubation media they resided. AGE assay results At study outset and weekly thereafter, thin strips (1-2mm in width) of each specimen were excised and frozen (-70°C). At the conclusion study, 48 of the 72 frozen sub-specimens were analyzed for CML and pentosidine content. The assayed samples included all hyperglycemic sub-specimens (24), and one-half of both the control (12) and anaerobic groups (12). The control and anaerobic subgroups included all of the initial and final sub-specimens from the respective groups. AGE concentration versus study day are shown in the left-side plots. The pentosidine vs CML concentration for each specimen is plotted at the right. Clear AGE accumulation occurred in specimens residing in the hyperglycemic solution while minimal accumulation was detected in the control group. The chelators and anaerobic conditions retarded but did not eliminate AGE accumulation in the specimens contained in that medium. Pentosidine and CML concentrations in individual specimens are highly correlated. Relative to the hyperglycemic group, however, pentosidine accumulated more rapidly than CML in the anaerobic and control groups. Each incubation medium thus has a different slope in the right panel. Principal Components Analysis The upper figures illustrate representative results from the PCA decomposition of a spectral data set. The 1st PCA factor for the excitation spectra (x = 315 – 385nm; m = 400nm) is shown in the upper left panel. This spectral shape accounts for 98.9% of the variance in that data set. In the upper right panel, the PCA scores for the 1st factor are plotted vs the respective pentosidine concentrations. The specimens are color-coded by incubation medium and the symbols denote the specimens (circles = 1, x = 2, squares = 3 & triangles = 4). PCA decomposition was performed on all data sets. An Ordinary Least Squares (OLS) fit was performed by regressing the PCA scores on the AGE concentrations (pentosidine) after removing global time trends. The significance of the score/AGE relationship for individual PCA factors (-log(p)) are plotted in the lower panel. The number of factors presented for each spectral set accounts for 99.95% of the spectroscopic variance in that set. The critical value (p = 0.01) is indicated by the dotted line. The bars noted with * represent p-values that were less than the sensitivity of the calculation (p=0.001) and were thus set to 0.0005. Partial Least Squares The upper figures illustrate representative results from PLS analysis of an excitation fluorescence set (x = 325 – 445 nm; m = 460nm). The upper left figure illustrates the Standard Error of Prediction as a function of increasing PLS model factors (latent variables). The red circle indicates the optimal number of model factors. The model predictions of pentosidine concentration vs the study day are plotted in the upper right panel. Similar PLS analysis was performed for each spectroscopic data set. The variance in pentosidine concentrations explained by the respective models are plotted in the lower figure. The bars marked by * indicate variance reductions that are statistically significant (p=0.05). Conclusions • Fluorescence • Spectral changes strongly correlated to AGE progression • Active spectral regions consistent with collagen cross-linking • Promising method for quantitative in vivo AGE measurement • NIR • Relationship between NIR spectra and AGEs uncertain • Study results infer AGE chemistry does not have strong NIR signature; current experiment may lack sufficient sensitivity to identify this interaction • In previous human studies, other diabetes-related skin modifications may be responsible for classification; necessitates further investigation Acknowledgements This research was funded by LifeScan, Inc. Water bands Collagen features Collagen features FTIR System Fluorimeter