Download
1 / 24
280 likes | 502 Vues
Railways and the Raj: The Economic Impact of Transportation Infrastructure. Dave Donaldson (d.j.donaldson@lse.ac.uk). Research Questions. What is the effect on economic outcomes of opening up to external (ie. international) trade?

E N D
Railways and the Raj: The Economic Impact of Transportation Infrastructure Dave Donaldson (d.j.donaldson@lse.ac.uk)
Research Questions • What is the effect on economic outcomes of opening up to external (ie. international) trade? • What is the effect on economic outcomes of enabling internal (ie. inter-regional) trade? • What are the economic gains from improving transportation infrastructure? • Why economic change underpins these effects?
Motivation • Our understanding of the effects of openness to trade is still incomplete: • External trade: usually all of country liberalises trade at same time, so finding counterfactuals is difficult • Internal trade: virtually unexplored, for lack of data • Transportation infrastructure is a dominant important policy issue in LDCs (eg WDR 1994), yet evidence base is lacking • very hard to evaluate, due to endogenous placement
This paper • Collect new dataset on prices, wages, production (agricultural), and trade at the district-level (N=~300) in India, from 1870-1925 • Use features of colonial construction of railways (1850-1900) in India as a set of ‘natural experiments’ in openness • Military motive (responding to domestic and foreign aggression) • Famine-prevention motive • Study impact of railways on agricultural output • Interpret this impact in context of a simple trade model • Predicts specialisation in comparative advantage crops • Use data on internal and external trade flows to examine this mechanism • Where data permits, examine other possible mechanisms (capital and labour reallocations, technological change)
Why Colonial India? • This region and period of history offer a number of institutional and methodological advantages: • Railway system was dramatic shock (in most of India at this time, road and river transport was poor/non-existent) • Railway line placement motives were non-economic in many instances • Availability of unique internal trade data • Allows external trade to be studied using within-country variation • Allows internal trade to be studied
Related Literature • Effect of openness, using natural experiment approach: • Bernhofen-Brown (JPE ‘03, AER ‘04) use Japan’s 1851 (forced) openness to test comparative advantage mechanisms behind opening • Michaels (2006) uses US Interstate highway expansion to study effect of openness on skill premium • Quantifying the gains from railways: • Fogel (1967) on USA: uses ‘social savings’ technique, ignores endogenous placement • Hurd (1998) on India: same method; finds large effect (9% of GDP in 1900)
This presentation • Background: • Railways • Economic environment • Elements of a simple theoretical framework for thinking about these issues • Data • Empirical method • Identification strategy for estimating effect of railways • What economic mechanisms underpin this effect?
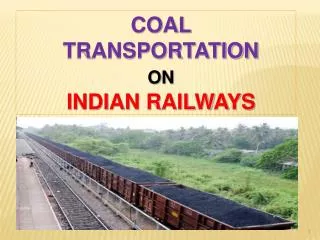
Background: Railways • Principal public investment in colonial India (over half of government spending) • Mixtures of pure public and public-private provision, but Indian Government always determined route selection • 95% of current lines built in 1853-1930 • 1870-1920 was highest growth period
1870 65 districts had railway somewhere in district
1900 170 districts had railway somewhere in district
1930 220 districts had railway somewhere in district
Background: Economic Environment (1) • Structure of economy in 1870: • Agriculture: 68% of GDP, (73% of labour) • Small-scale manuf. and services: 26%, (26%) • Large-scale manufacturing: 0.5%, (0.2%) • Structure of economy in 1930: • Agriculture: 59%, (75%) • Small-scale manuf. and services: 34%, (23%) • Large-scale manufacturing: 4%, (2%)
Background: Economic Environment (2) • Effect of railways on transport costs: • Standard estimates suggest that the pure freight costs of railways were 5-10 times lower than on alternative method (bullock carts) • However, this ignores other savings: • Bullocks/roads seasonal (bullocks need food/water, roads unpassable for
Data (1870-1930) • Agricultural production (annual, ~300 districts/native states): • Yields, by crop (~15 crops) • Land area allocations, by crop • Capital stocks (livestock, carts) • Irrigated areas, by crop • Prices and wages (annual, ~200 districts/native states) • Prices: by ~30 commodities • Wages: by ~5 occupations (skilled and unskilled) • Trade (annual, ~70 trade blocks): • Internal trade: full block-to-block matrix of trade flows (but intra-block diagonals empty) • External trade: trade by port, by foreign country • All in physical units, by commodity (~100 goods), by mode of transportation (rail, river, coast)
Limitations of the Data • Agricultural Yields: • Subject of much controversy among econ historians • Created by multiplying normal yields (factual) by subjective ‘conditioning factor’ • But largely corroborated by quinquennial crop-cutting surveys (and no obvious signs that this is not just classical ME) • Trade data: • External trade flows by block not collected • have to make assumptions of constant port consumption, and no port transformation • Roads data very limited in coverage • Lack of unit values may obscure quality-differentiation within observed commodity classifications
The second stage • Run regressions of form: y = real agricultural output R = shortest distance from (population-weighted geographic) centre of district to railway X= other controls d = district t = year • Can then think of modifying how R is included, to allow for heterogeneous treatment • Distance to port (and which port) • Distance to internal cities, or other markets
The first stage • Run regressions of form: • Where Z is a variable that predicts R, but has no direct effect on y
General IV set-up (1) • Railways are lines designed to connect two points, A and B • For any points (A,B), and the observed railway between them, can ask: • What is the effect of the railway on A or B? • What is the effect of the railway on intervening point C? C RCdt = d d A B RAdt ~=0 RBdt ~=0
General IV set-up (2) • Challenge is to find A-B pairs, such that: • (1) the decision to put a railway between A and B had nothing to do with unobservable characteristics of C • (2) there is nothing unobservably different about locations C along the line from A-B • It is very unlikely that A or B can be used in the analysis, for fear that exclusion restriction violated there • So ideally want 2 or more IVs, with very different types of A-B pairs
Instrumental Variables (Option 1): Famine-prevention in 1880 • 1880 Famine Commission recommended a number of railways to be built • This was idiosyncratic feature of that Commission: earlier and later Famine Commissions did not recommend any railways • Translation into instrument • A: locations of abnormally low rainfall in 1877-78 • B: nearest point to A that is on an 1879 railway line • Control for rainfall variation (at C) throughout period
Instrumental Variables (Option 2) – Military Transportation • Macpherson (1955) estimates that over half of track placement decisions were militarily-driven • British government was motivated by internal control, and external border defence (esp. Afghanistan border) • Translation to IV: • A: sites of suspected military action, not already on a railway at time t • B: nearest military cantonment (base) to A, or nearest point on existing railways to A
What mechanisms drive the result? • Obtain a 2SLS estimate , but what is driving this change? • Specialisation? • Specialisation according to comparative advantage? • Capital accumulation: • returns to capital higher? • railways affected banks’ ability to monitor borrowers? • Labour supplied to agriculture changes? • Higher wage draws in labour from other sectors? • Railways enable migration? • Land used in agriculture increases? • Extension of land cultivation margin (deforestation etc.)? • More double-cropping? • Technological progress? • Returns to innovation higher (size of market larger)? • Technology transfer on the railways?
Conclusion • Have presented plans for future research designed to help address important gaps in our understanding of external and internal openness • What is the effect of openness? • What is driving this effect?