Download
1 / 11
110 likes | 201 Vues
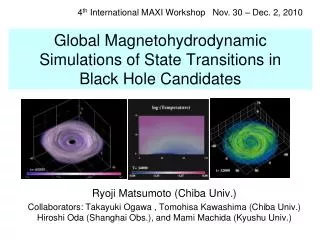
Global MHD Simulations of State Transitions and QPOs in Black Hole Accretion Flows. Machida Mami (NAOJ) Matsumoto Ryoji (Chiba Univ.). Time. State transition in GX339-4. Power Spectrum. Hardness Intensity Diagram. Belloni et al. (2006) fig.3. Low/hard state. Hard intermediate state.

E N D
Global MHD Simulations of State Transitions and QPOs in Black Hole Accretion Flows Machida Mami (NAOJ) Matsumoto Ryoji (Chiba Univ.)
Time State transition in GX339-4 Power Spectrum Hardness Intensity Diagram Belloni et al. (2006) fig.3 Low/hard state Hard intermediate state Belloni et al.(2006) fig.2 Low/hard state : Typically, no QPO, break around 10Hz sometimes broad low-frequency QPO appears Hard intermediate state : narrow double peak QPO moves to higher frequency
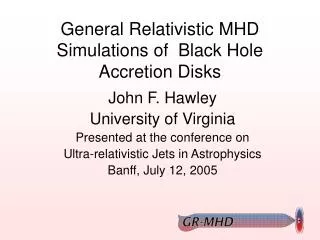
Advection ADAF Radiation Q-=Q-rad (BB) P = Pgas SADM What is the origin of luminous hard state? Abramowicz et al. (1995) M/Msun=10, r/rg=5,α=0.1 Mass accretion rate 1%LEdd Q-=Q-adv P=Pgas Surface density Maximum luminosity of the ADAF branch when α=0.1 is below 10% of the Eddington luminosity Maximum luminosity of GX 339-4 in hard state about 40 % of Eddington luminosity This luminous hard state cannot be explained in conventional ADAF models.
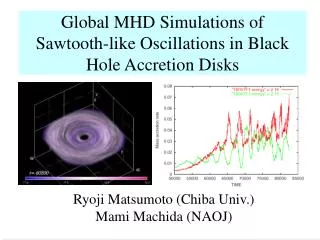
Surface density Optically thin, luminous low-βdisk Isosurface of the plasma β M-Σrelation obtained from simulations Thermal equilibrium curve with low-βbranch Machida et al. (2006) Oda et al. (2006) • In order to study the state transition from low/hard state to soft state, we focus on the effect of optically thin radiative cooling. • Due to the vertical contraction of the disk by cooling instability, low-βdisk is formed. • The low-βdisk stays in an optically thin, thermally stable new equilibrium state supported by magnetic pressure. • The luminosity of low-βdisk can exceed 10% of Eddington luminosity.
Purpose of this talk • We focus on the hard state corresponding to the radiativelly inefficient accretion flow and its low frequency QPOs. • For this purpose, we carried out global MHD simulations of optically thin accretion disk: • High temperature disk model corresponds to ADAF • Low temperature disk model corresponds to cooling-dominated disk.
Basic Equations Resistive Magneto-hydrodynamic Equations
Initial condition Equilibrium torus threaded by weak toroidal magnetic fields (Okada et al.1989) Unit Radius : rg=1rg: Schwarzschild radius Velocity: c(light speed)=1 Density : ρ0=1 Parameter Radius of the density max. of the initial torus r0 = 35, 50 rg Angular momentum distribution L = L0 r0.43 ,L0 The ratio of gas pressure to magnetic pressure β≡Pgas/Pmag=100 at r=r0 Specific heat ratioγ=5/3 Electric resistivity η=5×10⁻⁴ Sound speed (disk) cs = 0.01 c, 0.03c The density ratio of halo to disk ρh0/ρ0=10-4 Critical ion-electron drift velocity vc=0.9 Magnetic energy Density Z r
Snap shots of density distribution High temperature(HT) model Low temperature (LT) model Top panels show the density distribution averaged in the azimuthal direction. Bottom panels show the density averaged in vertical direction |z|<1. In the case of HT, the accreting gas froms a spiral shape. In model LT, inner torus is formed. The inner torus deforms itself into a crescent like shape. The inner torus has a constant angular momentum.
Time evolution of magneic fields High temperature Low temperature Angular momentum Radial distribution of specific angular momentum. Black:HT, Pink: LT Angular momentum distribution depends on the disk temperature, although the averaged plasma β does not depend on the disk temperature. Top panels: Time evolution of plasma β Bottom : Time evolution of mean radial magnetic field
PDS of the mass accretion rate model LT Right panel shows the power density spectrum integrated in 3<r<6. Black and blue curves show the model LT and HT, respectively. In model HT, we can not see the peak around 0.1<ν<10. But in model LT, broad peaks appears around 10Hz and narrow peaks appear around 100Hz and 140Hz. Left panel shows the r-ν distribution of Fourier Power of mass accretion rate measured during the time range 55000<t<61000. In these panels, we assume a 5.8 solar mass black hole, so 10000t0 corresponds to 0.58sec.
Conclusion • Angular momentum transport rate is dependent on the disk temperature. • When the disk temperature becomes low, angular momentum transport rate becomes small and a constant angular momentum inner trous is formed around 4-8rs. • The crescent-shape non-axisymmetric (m=1) density distribution grows and disappears quasi-periodically. • When the magnetic field is amplified enough, magnetic reconnection takes place and the crescent shape is destroyed. • The inner torus oscillation excites the high-frequency QPO around 100Hz when we assume 5.8 solar mass black hole.