Download
1 / 1
10 likes | 102 Vues
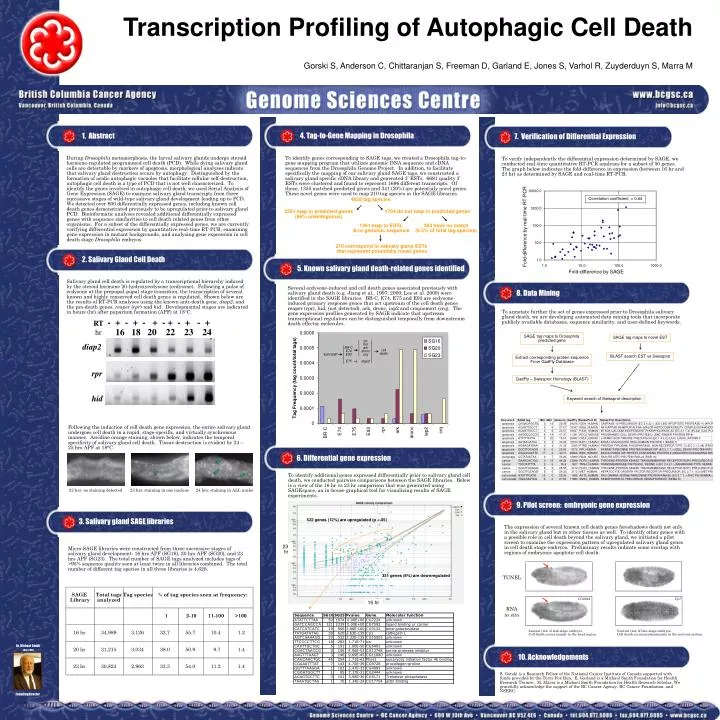
- + - + - + - + - + - +. 16 18 20 22 23 24. diap2. RT hr. rpr. rpr hid ark dronc crq diap2. SAGE tag maps to Drosophila predicted gene. BR-C E74 E93 E75. SAGE tag maps to novel EST. cell death. EcR/USP. hid.

E N D
- + - + - + - + - + - + 16 18 2022 23 24 diap2 RT hr rpr rpr hid ark dronc crq diap2 SAGE tag maps to Drosophila predicted gene BR-C E74 E93 E75 SAGE tag maps to novel EST cell death EcR/USP hid BLAST search EST vs Swissprot Extract corresponding protein sequence From GadFly Database GadFly – Swissprot Homology (BLAST) Keyword search of Swissprot description 522 genes (12%) are upregulated (p <.05) 23 hr 331 genes (8%) are downregulated SAGE Library Total tags analyzed Tag species % of tag species seen at frequency: 16 hr Cp1 CG2444 1 2-10 11-100 >100 16 hr 34,989 3,126 32.7 55.7 10.4 1.2 20 hr 31,215 3,034 38.0 50.9 9.7 1.4 23 hr 30,823 2,963 33.3 54.0 11.2 1.4 Transcription Profiling of Autophagic Cell Death Gorski S, Anderson C, Chittaranjan S, Freeman D, Garland E, Jones S, Varhol R, Zuyderduyn S, Marra M Verification of Differential Expression 4. Tag-to-Gene Mapping in Drosophila 1. Abstract 7. Verification of Differential Expression During Drosophila metamorphosis, the larval salivary glands undergo steroid hormone-regulated programmed cell death (PCD). While dying salivary gland cells are detectable by markers of apoptosis, morphological analyses indicate that salivary gland destruction occurs by autophagy. Distinguished by the formation of acidic autophagic vacuoles that facilitate cellular self-destruction, autophagic cell death is a type of PCD that is not well characterized. To identify the genes involved in autophagic cell death, we used Serial Analysis of Gene Expression (SAGE) to examine salivary gland transcripts from three successive stages of wild-type salivary gland development leading up to PCD. We detected over 800 differentially expressed genes, including known cell death genes demonstrated previously to be upregulated prior to salivary gland PCD. Bioinformatic analyses revealed additional differentially expressed genes with sequence similarities to cell death related genes from other organisms. For a subset of the differentially expressed genes, we are currently verifying differential expression by quantitative real-time RT-PCR, examining gene expression in mutant backgrounds, and analyzing gene expression in cell death stage Drosophila embryos. To identify genes corresponding to SAGE tags, we created a Drosophila tag-to-gene mapping program that utilizes genomic DNA sequence and cDNA sequences from the Drosophila Genome Project. In addition, to facilitate specifically the mapping of our salivary gland SAGE tags, we constructed a salivary gland specific cDNA library and generated 3’ ESTs. 6681 quality 3’ ESTs were clustered and found to represent 1696 different transcripts. Of these, 1355 matched predicted genes and 341 (20%) are potentialy novel genes. These novel genes were used to map 210 tag species in the SAGE libraries. To verify independently the differential expression determined by SAGE, we conducted real-time quantitative RT-PCR analyses for a subset of 50 genes. The graph below indicates the fold-difference in expression (between 16 hr and 23 hr) as determined by SAGE and real-time RT-PCR. Correlation coefficient = 0.64 4628 tag species 2561 map to predicted genes (96% unambiguous) 1764 do not map to predicted genes Align me! 1461 map to ESTs &/or genomic sequence 303 have no match (6.5% of total tag species) Fold-difference by real-time RT-PCR Align me! 210 correspond to salivary gland ESTs that represent potentially novel genes 2. Salivary Gland Cell Death Multiple Pictures 5. Known salivary gland death-related genes identified Fold-difference by SAGE Salivary gland cell death is regulated by a transcriptional hierarchy induced by the steroid hormone 20-hydroxyecdysone (ecdysone). Following a pulse of ecdysone at the prepupal-pupal stage transition, the transcription of several known and highly conserved cell death genes is regulated. Shown below are the results of RT-PCR analyses using the known anti-death gene, diap2, and the pro-death genes, reaper (rpr) and hid. Developmental stages are indicated in hours (hr) after puparium formation (APF) at 18°C. Several ecdysone-induced and cell death genes associated previously with salivary gland death (e.g. Jiang et al., 1997; 2000; Lee et al. 2000) were identified in the SAGE libraries. BR-C, E74, E75 and E93 are ecdysone-induced primary response genes that act upstream of the cell death genes reaper (rpr), hid, (not detected), ark, dronc, iap2 and croquemort (crq). The gene expression profiles generated by SAGE indicate that upstream transcriptional regulators can be distinguished temporally from downstream death effector molecules. 8. Data Mining To annotate further the set of genes expressed prior to Drosophila salivary gland death, we are developing automated data mining tools that incorporate publicly available databases, sequence similarity, and user-defined keywords. Following the induction of cell death gene expression, the entire salivary gland undergoes cell death in a rapid, stage-specific, and virtually synchronous manner. Acridine orange staining, shown below, indicates the temporal specificity of salivary gland cell death. Tissue destruction is evident by 24 – 25 hrs APF at 18°C. 6. Differential gene expression To identify additional genes expressed differentially prior to salivary gland cell death, we conducted pairwise comparisons between the SAGE libraries. Below is a view of the 16 hr vs 23 hr comparison that was generated using SAGEspace, an in-house graphical tool for visualizing results of SAGE experiments. 22 hrs: no staining detected 23 hrs: staining in one nucleus 24 hrs: staining in ALL nuclei 9. Pilot screen: embryonic gene expression 3. Salivary gland SAGE libraries The expression of several known cell death genes foreshadows death not only in the salivary gland but in other tissues as well. To identify other genes with a possible role in cell death beyond the salivary gland, we initiated a pilot screen to examine the expression pattern of upregulated salivary gland genes in cell death stage embryos. Preliminary results indicate some overlap with regions of embryonic apoptotic cell death. small vertical clearance check Micro-SAGE libraries were constructed from three successive stages of salivary gland development: 16 hrs APF (SG16), 20 hrs APF (SG20), and 23 hrs APF (SG23). The total number of SAGE tags analyzed includes tags of >95% sequence quality seen at least twice in all libraries combined. The total number of different tag species in all three libraries is 4,628. TUNEL RNA in situ Lateral view of mid-stage embryos. Cell death occurs mainly in the head region. Ventral view of late-stage embryos. Cell death occurs predominantly in the nervous system. Dr. Michael Smith 1932-2000 10. Acknowledgements S. Gorski is a Research Fellow of the National Cancer Institute of Canada supported with funds provided by the Terry Fox Run. E. Garland is a Michael Smith Foundation for Health Research Trainee. M. Marra is a Michael Smith Foundation for Health Research Scholar. We gratefully acknowledge the support of the BC Cancer Agency, BC Cancer Foundation, and NSERC. Founding Director