Download
1 / 37
370 likes | 509 Vues
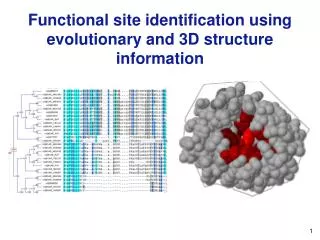
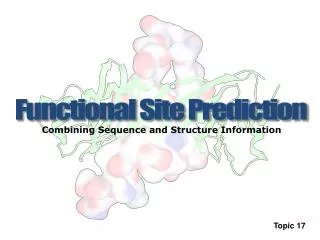
Functional Site Prediction. Combining Sequence and Structure Information. Topic 17. +. Problem: Identify the most important region(s). What is a functional site? This is actually a very difficult question to answer robustly. Of course, “ catalytic residues ” are functional sites.

E N D
Functional Site Prediction Combining Sequence and Structure Information Topic 17
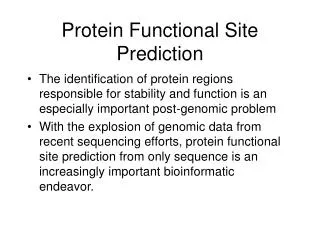
+ Problem: Identify the most important region(s) What is a functional site? This is actually a very difficult question to answer robustly. Of course, “catalytic residues” are functional sites. Generally, we assume other site directly interacting with the substrate or other proteins involved in a complex to be functional. However, what about sites far removed from the “active site region?” If a mutation at one of these sites is deleterious, is it functional?
+ Problem: Identify the most important region(s) Catalog of Important Sites (KC and Livesay) Catalytic Sites: Sites that are identified as catalytic sites in the Catalytic Site Atlas (CSA). Active Sites: Union of CSA catalytic residues and all residues contacting the catalytic residues using HBPLUS. Ligand-Binding Sites: Sites identified by characterizing all enzyme-ligand interactions using HBPLUS. What about Allosteric Sites? Structural Sites? Etc?
+ Methods Typical approach: Combine sequence and structural information Alignment Content: Sequence conservation and phylogeny-based. Typically also use structural information. Machine-Learning Methods: Computational “black boxes,” but give good results. Structure Features:Graph theoretic methods, protein surface shape, protein surface physiochemical properties, etc. Triosephosphate isomerase color-coded by conservation
+ Catalytic Site Atlas
+ Catalytic Propensity
+ Multiple Sequence Alignment
+ Multiple Sequence Alignment The Sum of Pairs(SP) score of column miis calculated as above where s(mk,ml) is the scoring matrix substitution value. The sum is enumerated over all possible pairs within a single alignment column. The Shannon entropy (S) score is calculated where piis the probability of each residue i in that column. Very similar, the Williamson Property Entropy (WPE), sums of groups of chemically similar residues (k=9), where the probability within the logarithm is normalized by the average column probability Rate4site(R4S) constructs a mathematical description of the underlying phylogeny in order to improve determination the rate of evolution at each site. The rate of evolution at each site is then estimated using the maximum likelihood principle, which considers both phylogenetic tree branch lengths and the stochastic nature of evolution. And many others.
+ Relative predictive power
+ ConSurf is a web-implementation of R4S
Relative importance of input variables Gutteridge et al., JMB (2003) 330:719-734.
Using structural clustering to filter out FP’s Structural clustering improves results Unfortunately the method tends to over-predict catalytic residues + = Three different NN’s Gutteridge et al., JMB (2003) 330:719-734.
Going beyond conservation HKAMMKLQWBBMVRERCUGDYAD HRAFGSGFFBYTUJGGCADFYDD EFZHRDADFD-EGHDGCVRRSER ADZDFDAADFDEHGRRCADDSDD DFZBBDMJJJ-EDAFDCRRVSHT ADHADFDEBGJEVEEECADDSDD NTHLJDJDDGUEKJFJCLDLSEI OOHMCVDUEGTEDDEDC--DSEI JDILKJADFFIFEVEECLDKSVV JBIOUDFFVFCFLKEICKDKSEE Of course, well conserved positions make very good functional site predictions. But what defines differences between sub-families in the overall phylogeny?
Evolutionary trace (aka tree-determinant) residues ..A........B....C...Y.. ..A........B....C...Y.. ..Z..D.....E....C...S.. ..Z..D.....E....C...S.. ..Z..D.....E....C...S.. ..H......G.E....C...S.. ..H......G.E....C...S.. ..H......G.E....C...S.. J.I......F.F....C...S.. J.I......F.F....C...S.. Analyze to detect those residues with a tendency to be conserved within a subfamily of proteins, but which differ between subfamilies (tree-dependent positions), and regard them as a result of the evolutionary scenario in which conservation and specificity are present in a delicate balance.
Evolutionary trace (aka tree-determinant) residues • Identifying and understanding the role of the essential sites that determine the structure and proper functioning of the molecule. • A thorough evaluation of the importance of all sequence sites involves extremely time-consuming and laborious biochemical experimental methods. • All methods presented here rely on some sort of co-evolutionary theme. Or put otherwise, Nature has allowed some plasticity within (some) functional positions assuming the appropriate conditions are met elsewhere. • Starting from the groundbreaking Lichtarge et al. paper in 1996, there have been several approaches presented that use this intra-family co-evolution principle to predict functional sites. The methods, called evolutionary trace, tree determinate residues, phylogenetic motifs, ConSurf, and strong motifs are conceptually similar and provide somewhat consistent results.
Evolutionary trace (aka tree-determinant) residues The ET process
Structural clusters of ET overlap ligand binding sites Active site Trace residues 97% of the time (37 of 38 examples), the largest cluster of trace residues contacts the ligand (Madabushi et al, Journal of Molecular Biology, 2002).
What leads to conservation of CuZnSOD surface electrostatics? Livesay et al. (2003). Biochemistry 42:3464-73.
Structural and structure variability Livesay et al. (2003). Biochemistry 42:3464-73.
An improbable result Stephen Jay Gould said,“The proof of evolution lies in those adaptations that arise from improbable foundations.” Livesay et al. (2003). Biochemistry 42:3464-73.
Phylogenetic motifs Notice structural clustering despite little overall sequence proximity Triosephosphate isomerase window width = 5 PSZ threshold = -1.5 TIM Prosite definition La, Sutch, Livesay (2005). Proteins 58:309-320.
TATA-box binding protein Copper, zinc-superoxide dismutase Inorganic pyrophosphatase Myoglobin Cytochrome P450
Glecerolaldehyde-3-phosphate dehydrogenase Glutamate dehydrogenase Enolase Alcohol dehydrogenase
PMs identify sequence clusters of ET residues Trace residues that correspond to PMs are colored red. Trace residues that do not correspond to PMs are colored blue.
PMs also correspond to traditional motif definitions La, Sutch, Livesay (2005). Proteins 58:309-320.
That is, PMs represent a subset of motif space La, Sutch, Livesay (2005). Proteins 58:309-320.
APSRKFFVGGNWKMNGRKQSLGELIGTLNAAKVPADTEVVCAPPTAYIDFARQKLDPKIAVAAQNCYKVTGAFTGEISPGMIKDCGATWVVLGHSERRHVFGESDELIGQKVAHALAEGLGVIACIGEKLDEREAGITEVFEQTKVIADNVKDWSKVVLAYEPVWAIGTGKTATPQQAQEVHEKLRGWLKSNVSDAVAQSTRIIYGGVTGATCKELASQPDVDGFLVGGASLKPEFVDIINAKQAPSRKFFVGGNWKMNGRKQSLGELIGTLNAAKVPADTEVVCAPPTAYIDFARQKLDPKIAVAAQNCYKVTGAFTGEISPGMIKDCGATWVVLGHSERRHVFGESDELIGQKVAHALAEGLGVIACIGEKLDEREAGITEVFEQTKVIADNVKDWSKVVLAYEPVWAIGTGKTATPQQAQEVHEKLRGWLKSNVSDAVAQSTRIIYGGVTGATCKELASQPDVDGFLVGGASLKPEFVDIINAKQ
Np: total number of vertices Lij: shortest path between i and j Vertex: Cα Edge: if distance is within 8.5Å
Centrality metrics Degree (aka, connectivity or valency): Simply the integer count of the number of edges a vertex shares. Closeness: The closeness centrality, CC, for a vertex v is the reciprocal of the sum of geodesic distances to all other vertices in the graph. Geodesic distance (aka, shortest path): The number of edges in the shortest path connecting two vertices. 6 4 5 3 2 1 Note: this assumes constant edge weights
Protein networks • The networks are usually highly clustered with few links connecting any two random vertices. • A key feature of many complex systems (including protein networks) is robustness, meaning that the system can continue to function despite perturbations. • On the other hand, robustness is coupled with fragility toward non-trivial rearrangements of the connections between the system’s key internal parts. • Proteins are no exception, they have evolved toward a robust design; however, they are vulnerable to mutation at certain residues, meaning that some special importance could be placed on central residues. • Recently, various centrality scores have been • used to predict folding nuclei and catalytic sites.
Protein networks conserve “hubs” • del Sol et al., Mol Sys Biol (2006).
Close residues are typically buried… However, there is a clear distinction b/t buried noncatalytic and catalytic sites. Catalytic residues One third most buried residues Middle third One third least buried residues • Chea and Livesay (2007), BMC Bioinformatics, 8:153.
Catalytic site prediction power Closeness centrality... Non-catalytic residues Catalytic residues ROC curve for CC predictions • Chea and Livesay (2007), BMC Bioinformatics, 8:153.
Simple steps to improve accuracy Raw predictions Accessibility filter Residue identity filter Computed p-values on the null hypothesis that CC does not predict catalytic sites better than random.