Download
1 / 24
240 likes | 425 Vues
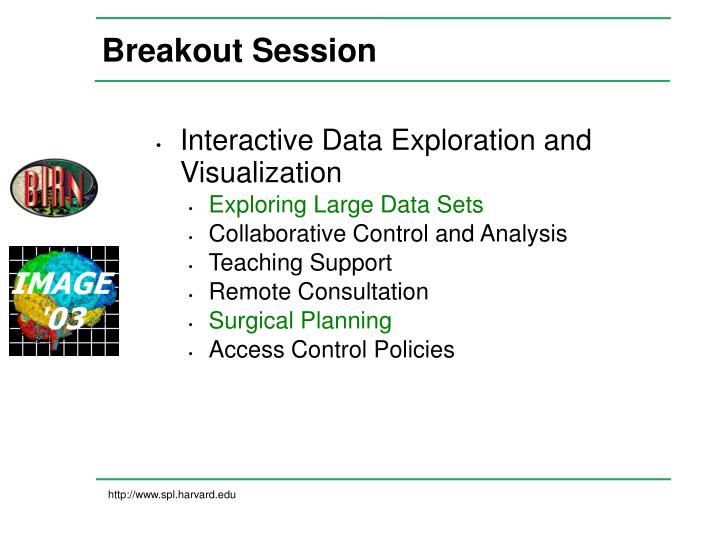
Breakout Session. Interactive Data Exploration and Visualization Exploring Large Data Sets Collaborative Control and Analysis Teaching Support Remote Consultation Surgical Planning Access Control Policies. Particpants. Kazunori Nozaki – Osaka U – Dentist, CFD

E N D
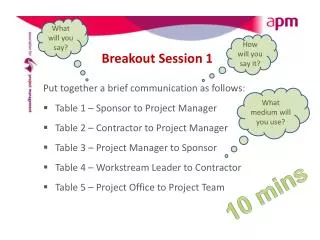
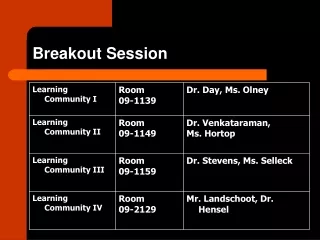
Breakout Session Interactive Data Exploration and Visualization Exploring Large Data Sets Collaborative Control and Analysis Teaching Support Remote Consultation Surgical Planning Access Control Policies
Particpants Kazunori Nozaki – Osaka U – Dentist, CFD Chao Quan Chen – Edinburgh Med Ultrasound Processing 300 MB Martin Connell – Edinburgh – Visualization, Processing... Cecilia Germain – Computer Research Lab Paris – Online Radiology Grid Nick Avis – Cardiff U – Computational Steering, large scale viz Daniel Hanlon – Daresbury Laboratory – Globus/grid/portals – med Sofie Norager – EC – HealthGrid Merging Biomedical informatics Richard Ansorge – U Cambridge – Cancer care telemedicine, viz Steve Pieper – SPL / BIRN – Surgical Planning, Viz
Applications Therapy Planning Intra-operative sugical assist – interactive IMRT (Radiation Treatement Planning) – medium term Volume measurement – continuum from small interaction/large computation to large interaction/computation. Interactive Rendering Volumetric segmentation Adaptive control of instrumentation
Categories of Visualization Today Simple Tabular / Histogram Static Rendering Movies Large Data Model – Astro, CFD -> MEG, Want to have Interactive Static Data Set 2D, 3D, 4D, Multi-Modal, Populations, Multi-Scale... Dynamic – rendered on the fly Interactive Dynamic Data Set Simulation/Calculation on the fly Computational Steering Tiled / distributed rendering
Middleware Requirements Scheduling Priority Allocation Administrative control of priories 3 Levels of task types Low – scheduling small tasks on grid Medium – like the scheduler itself Large – workflow (classical grid – globus, grid services) Quality Of Service Auditing of resource usage Level 2 Grid – some hardware is being dedicated to grid use, with interactive applications being allowed
Enabling Tools VNC - xf4vnc.sf.net – GLX enabled vnc with tight vnc for unix Shared whiteboards Videoconferencing – e.g. Tandberg NAG Explorer – grid enabled SGI viz server
User Requirements Need More Example Applications Performance Evaluation of all levels of the programming stack What is the overhead of Grid Services? Methods to determine type of service you are connecting to and choose alternate implementations depending on type of service Comparison to dedicated cluster approaches to same problems Intelligent/Selective Data Access Standard file system API Move to Database as API
Scenario Migrate to new grid architecture from locally controlled machines Perception of local control Redundancy of compute resources provides better uptime than local machine
Market economy of resources Comparison with other resource markets (e.g. Electrical power) Need an overabundance of resources so that user needs can be accomodated in worst-case What are commercial companies doing?
Conclusions Grid is not ready for interactive use yet
Projects Distributed rendering techniques for large data using grid resources Multiple data types integrated in the rendering Text 2D images 3D volumes, vectors, tensors, tracts Models Annotations dynamic/kinetic models – metabolism, function Error metrics displayed in view Data from multiple simulations, instruments Parameter searches
Projects (Visual Semantic Grid!) Queryable Visual Elements BIRN Query Atlas Prototype – brain cortex parcelation click to launch web search Every object is a hot link to data about itself Metadata, provenance, source (sql or url from which it was loaded or best way to access it) “User profiles” to steer user to types of information (e.g. students vs. clinicians) Scalability to large numbers of users Multilingual Native language, technical vs non-technical Local expert translators Homologies between schools of thought (mediator)
Remote Resources on Confidential Data Scenario Clinican queries PACS for longitudinal patient data and sends dicom files to grid for registration and analysis How to keep the whole compute transaction secure even when calculations happen remotely Also important to industrial applications (e.g. Big pharma)
Issues More European / Asian experts could be drawn on Physics problems are different Better defined constraints on amount of data Off-line computations, data reduction Who do you trust? How to make the social/administrative parts of the grid authentication work (e.g. account creation) European datagrid project may have answers
Paper Topics Visualization Taxonomy API types to support “weights” of processing types (batch vs. function call) XML Schema for Semantically aware visual elements Caching/Random Access to Data Resource aware applications / proxy With application override possible
What is limitation of grid? Justify conclusion that grid is not yet suitable for interactive visualization What is overhead for grid services? What optimizations are possible? What are computer center policies that limit or enable interactive applications? What are the reasons for those policies? What hardware limitations influence ability to use grid resources interactively? Swapping? Do the cluster OS and queing systems allow pre-emptive multitasking?
Testbed Example code of grid aware visualization Software that can display the other testbed data
Other Groups Visualization needed for other groups With reference to our taxonomy Expert review QA Radiologist interpretation – unknown “gold standard”
Paper Outline for Visualization Scenario Generic Locally+Remotely Generated Large Dataset Remote Compute Resource Required Secure Communications Interactive Response / Computational Steering Potentially Large Output to Visualize/Interpret/Archive Radiology Specific for Clinical Research CT/MR/US/PET... longitudinal disease tracking 5D data sets, multi-component images Image Standardization / Calibration Inter-, Intra-subject/modality registration Accommodate instrument differences – seek state of the art techniques Patient confidential information protection Security or Deidentification Interaction Starting pose; Non-rigid registration needs help avoiding local minima Remote consultation and collaboration Data streaming of local and remote data
System Requirements On-demand computing – across weights of compute jobs (batch, in-between, interactive) Reduce overhead for initiating grid services (authentication, resource descovery...) Virtual Overabundance of Resources Pool IT budgets from individual researchers and share among groups What you need is almost always available to you Testbeds An instance of the interaction scenario either in registration or measurement Involved Clinical sites Application software sites Computer resource sites with grid infrastructure expertise and resources that can be dedicated to interaction experimentation – and with links to the grid infrastructure development groups to work on system requirements groups (Optional for Discussion: industrial partner) IBM, Sun, Dell... GE, Siemens, Philips... Big Pharma... Others...
Slicer - http://www.slicer.org • Flagship Application of the SPL • VTK, C++, Tcl/Tk, OpenGL • Modeling/Visualization Platform • Neuroscience Research • Surgical Planning • Source Available and Free for Non-Clinical Use
Exploring Large Data Sets • Example: Keyhole • Seamless transitions across multiple scales • Intuitive User Interface • Displays where data exists and where not • Integration of Imaging and non-imaging data • Multiple ways to find the data of interest (by feature type, name, address, interactive exploration...) • How to Adapt/Expand this to Medical Images?
Query Atlas Interface Project • An interface to interact with the BIRN database as easily as Keyhole interacts with the earth data • Draw on skills of SDF (award-winning information design firm) in genomics/proteomics visualization