Download
1 / 17
170 likes | 330 Vues
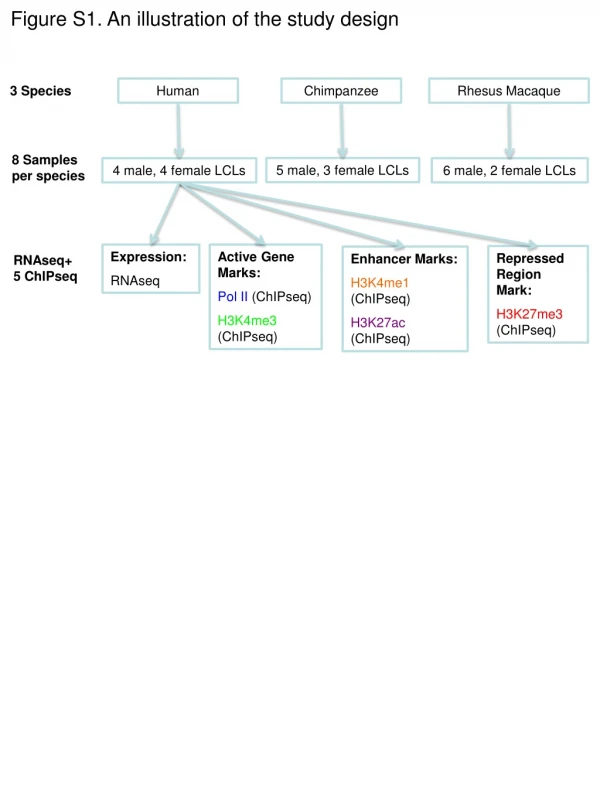
Figure S1. An illustration of the study design. 3 Species. Human. Chimpanzee. Rhesus Macaque. 8 Samples per species. 5 male, 3 female LCLs. 4 male, 4 female LCLs. 6 male, 2 female LCLs. Expression: RNAseq. Active Gene Marks: Pol II ( ChIPseq ) H3K4me3 ( ChIPseq ).

E N D
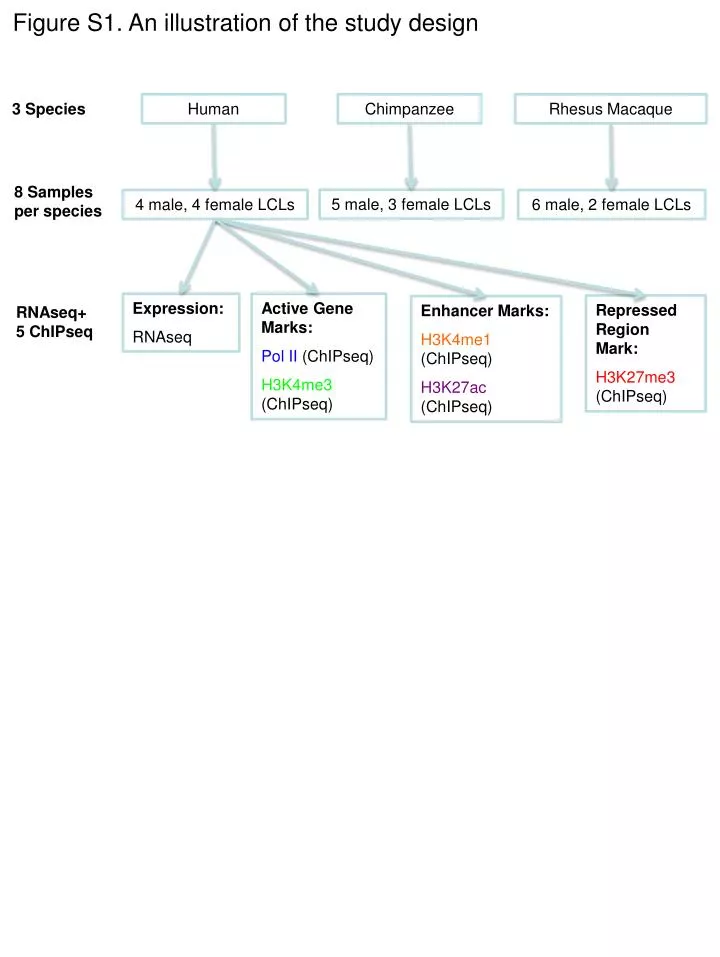
Figure S1. An illustration of the study design 3 Species Human Chimpanzee Rhesus Macaque 8 Samples per species 5 male, 3 female LCLs 4 male, 4 female LCLs 6 male, 2 female LCLs Expression: RNAseq Active Gene Marks: Pol II (ChIPseq) H3K4me3 (ChIPseq) Repressed Region Mark: H3K27me3(ChIPseq) Enhancer Marks: H3K4me1 (ChIPseq) H3K27ac (ChIPseq) RNAseq+ 5 ChIPseq
Figure S2. Choices of cutoffs for classifying regions as enriched
Figure S3. Pairwise Spearman’s rank correlations between individuals from the three primates for four histone marks, Pol II and RNA H3K4me1 H3K4me3 H H H C C C R R R H3K27ac H3K27me3 PolII RNA
Figure S4. Fold enrichment of the five marks in regions near TSSs in three primates A Fold Enrichment, TSS +/- 10 kb Human Chimpanzee Rhesus Macaque B Fold Enrichment, TSS +/- 50 kb Human Chimpanzee Rhesus Macaque H3K4me1 H3K4me3 H3K27me3 H3K27ac Pol II
Figure S5. Pairwise Spearman’s rank correlations between marks in each of the three primates -0.4 0.0 0.3 0.7 1.0 Chimpanzee Human Rhesus Macaque TSS +/- 2 kb TSS +/- 10 kb TSS +/- 50 kb
Figure S6. Mark enrichment levels are correlated with gene expression levels in chimpanzee Low Expressed Medium Expressed High Expressed Enrichment Level Distance to TSS (kb) Distance to TSS (kb) Distance to TSS (kb) R2 Scaled Enrichment Level TSS +/- 2kb TSS +/- 10kb TSS +/- 50kb Gene Expression Level marginal + interactions marginal H3K4me1 H3K4me3 H3K27me3 H3K27ac Pol II
Figure S7. Mark enrichment levels are correlated with gene expression levels in rhesus macaque Low Expressed Medium Expressed High Expressed Enrichment Level Distance to TSS (kb) Distance to TSS (kb) Distance to TSS (kb) R2 Scaled Enrichment Level TSS +/- 2kb TSS +/- 10kb TSS +/- 50kb Gene Expression Level marginal + interactions marginal H3K4me1 H3K4me3 H3K27me3 H3K27ac Pol II
Figure S8. Mark enrichment levels are plotted against gene expression levels for sliding windows of genes ordered by increasing expression levels in the three primates Human Chimpanzee Rhesus Macaque TSS +/- 10 kb Scaled Enrichment Level Scaled Enrichment Level TSS +/- 50 kb Gene Expression Level Gene Expression Level Gene Expression Level H3K4me1 H3K4me3 H3K27me3 H3K27ac Pol II
Figure S9. Scatterplot of predicted gene expression levels against true gene expression levels for all analyzed genes in human Predicted Gene Expression Level H3K4me1 H3K4me3 H3K27me3 H3K27ac Pol II True Gene Expression Level marginal
Figure S10. Importance of the marginal and first-order interaction effects from the five marks for explaining gene expression levels in the three primates 0.0 0.2 0.5 0.8 1.0 Marginal and Interaction Terms Posterior Inclusion Probability H3K4me1 H3K27ac Pol II H3K4me3 H3K27me3 H C R
Figure S11. TSS regions associated with inter-species differences in enriched marks are enriched for differentially expressed (DE) genes FDR < 2.5% FDR < 7.5% Fold Enrichment of TSS Associated with Inter-Species Mark Differences in DE Genes FDR < 10% H3K4me1 H3K4me3 H3K27me3 H3K27ac Pol II H vs C H vs R C vs R
Figure S12. An example of mark abundance and gene expression levels across three species EENSG00000076043, REX02 Human Chimpanzee Rhesus Macaque H3K4me1 H3K4me3 H3K27me3 RNA Input H3K27ac Pol II
Figure S13. Differences in mark enrichment level plotted against differences in gene expression level for sliding windows of genes ordered by increasing differences in expression level TSS +/- 10 kb H vs C H vs R C vs R Scaled Difference in Enrichment Level Difference in Gene Expression Level TSS +/- 50 kb Scaled Difference in Enrichment Level Difference in Gene Expression Level H3K4me1 H3K4me3 H3K27me3 H3K27ac Pol II
Figure S14. R squared by mark enrichment level differences for all pairwise comparisons among the three primates FDR < 2.5% FDR < 7.5% R2 FDR < 10% marginal + interactions marginal H3K4me1 H3K4me3 H3K27me3 H3K27ac Pol II H vs C C vs R H vs R
Figure S15. Scatterplot of predicted gene expression level differences plotted against true gene expression level differences for DE genes between human and chimpanzee Predicted Gene Expression Difference H3K4me1 H3K4me3 H3K27me3 H3K27ac Pol II True Gene Expression Difference marginal
Figure S16. Scatterplot of gene expression level differences plotted against sequence conservation and divergence for DE genes H vs C H vs R C vs R Difference in Gene Expression Level
Figure S17. R squared by four histone modifications and Pol II or by four histone modifications alone B A w/o Pol II w/ Pol II R2 in RNA R2 in Pol II H C R H C R C D w/o Pol II FDR < 5% w/ Pol II R2 in Pol II R2 in RNA H vs C H vs R C vs R H vs C H vs R C vs R marginal + interactions marginal H3K4me1 H3K4me3 H3K27me3 H3K27ac