Download
1 / 1
10 likes | 105 Vues
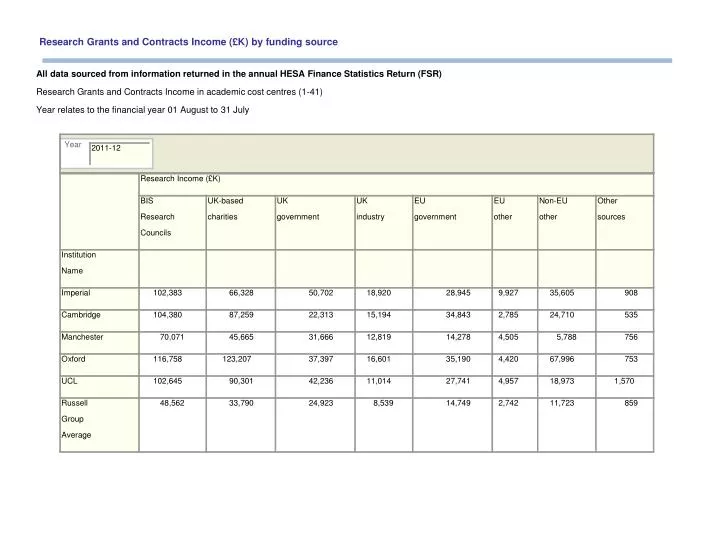
Research Grants and Contracts Income (£K ) by funding source. All data sourced from information returned in the annual HESA Finance Statistics Return (FSR). Research Grants and Contracts Income in academic cost centres (1-41). Year relates to the financial year 01 August to 31 July. Year.

E N D
Research Grants and Contracts Income (£K) by funding source All data sourced from information returned in the annual HESA Finance Statistics Return (FSR) Research Grants and Contracts Income in academic cost centres (1-41) Year relates to the financial year 01 August to 31 July Year 2011-12 Research Income (£K) BIS UK-based UK UK EU EU Non-EU Other Research charities government industry government other other sources Councils Institution Name Imperial 102,383 66,328 50,702 18,920 28,945 9,927 35,605 908 Cambridge 104,380 87,259 22,313 15,194 34,843 2,785 24,710 535 Manchester 70,071 45,665 31,666 12,819 14,278 4,505 5,788 756 Oxford 116,758 123,207 37,397 16,601 35,190 4,420 67,996 753 UCL 102,645 90,301 42,236 11,014 27,741 4,957 18,973 1,570 Russell 48,562 33,790 24,923 8,539 14,749 2,742 11,723 859 Group Average