Download
1 / 34
340 likes | 463 Vues
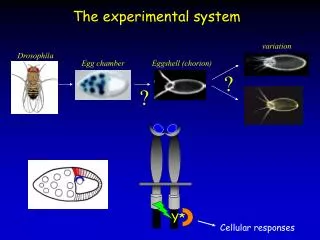
Annotation of Drosophila virilis. Chris Shaffer GEP workshop, 2006. Annotation of D. virilis. Outline of general technique and then one practical example This technique may not be the best with other projects (e.g. corn, bacteria) The technique optimized for projects:

E N D
Annotation of Drosophila virilis Chris Shaffer GEP workshop, 2006
Annotation of D. virilis • Outline of general technique and then one practical example • This technique may not be the best with other projects (e.g. corn, bacteria) • The technique optimized for projects: • Moderately close, well annotated neighbor species • No EST, mRNA or expression data available
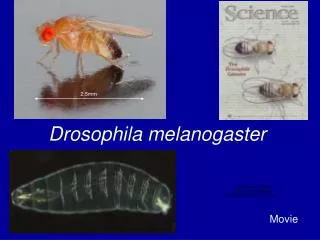
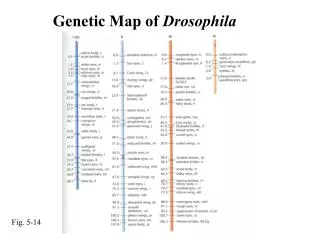
Helpful Hints • Evolutionary distance between D. virilis and D. melanogaster is much larger than chimp to human • Conservation will be at the protein domain level • Synteny is detectable in some fosmids • Most genes stay on the same chromosome (3 exceptions seen in ~40 genes)
D. virilis • Average gene size will be smaller than mammals • Very low density of pseudogenes • Almost all genes in virilis will have the same basic structure as melanogaster orthologs; mapping exon by exon works well for most genes
How to proceed First, identify features of interest: • Genscan results • Watch out for ends - fused or split genes • Regions of high similarity with D. melanogaster protein, identified by BLAST • Overlapping genes usually on opposite strand • Be vigilant for partial genes at fosmid ends • Regions with high similarity to known genes (i.e. BLAST to nr) not covered above
Basic Procedure For each feature of interest: • Identify the likely ortholog in D. m. • Use D. m. database to find gene model of ortholog and identify all exons • Use BLASTX to identify locations and frames of each exon, one by one • Based on locations, frames, and gene predictions, find donor and acceptor splice sites that link frames together; identify the exact base location (start and stop) of each coding exon • double check your results by translation
Basic procedure (graphically) fosmid feature BLASTX of predicted gene to melanogaster proteins suggests this region orthologous to Dm gene with 5 exons: BLASTX of each exon to locate region of similarity: 3 2 1 1 3
Basic procedure (graphically) 3 2 1 1 3 Zoom in on ends of exons and find first met, matching intron Doner (GT) and Acceptor (AG) sites and final stop codon 1 3 Met GT AG GT Once these have been identified, write down the exact location of the first base and last base of each exon. Use these numbers to check your gene model 1121 1187 1402 1591 1754 1939 2122 2434 2601 2789
Example Annotation • Open Safari and go to goose.wustl.edu • Click on Genome Browser
Example Annotation • Settings are: Insect; D. virilis; Mar. 2005; chr10 (chr10 is a fosmid from 2005) • Click submit
Example Annotation • Seven predicted Genscan genes • Each one would be investigated
Investigate 10.4 • All putative genes will need to be analyzed; we will focus on 10.4 in this example • To zoom in on this gene enter: chr10:15000-21000 in position box Then click jump button
Step 1: Find Ortholog • If this is a real gene it will probably have at least some homology to a D. melanogaster protein • Step one: do a BLAST search with the predicted protein sequence of 10.4 to all proteins in D. melanogaster
Step 1: Find Ortholog • Click on one of the exons in gene 10.4 • On the Genscan report page click on Predicted Protein • Select and copy the sequence • Do a blastp search of the predicted sequence to the D. melanogaster “Annotated Proteins” database at http://flybase.net/blast
Step 1: Find Ortholog • The results show a significant hit to the “A” and “B” isoforms of the gene “mav”
Step 1: Results of Ortholog search • The alignment looks right for virilis vs. melanoaster- regions of high similarity interspersed with regions of little or no similarity • We have a probable ortholog: maverick
Step 2: Gene model • What does mav look like? • Go to ENSEMBL to get exons and map them to regions: • Web brower- go to www.ensemble.org
Step 2: Gene model • Click on Drosophila • Search for mav (top right search box) • Click on “Ensembl Gene: CG1901” • Scroll down to map and notice two isoforms:
Step 2: Gene model • We now have a gene model (two exon gene, two isoforms). • We will annotate isoform A since it is the largest. Due to time constraints, our policy so far is to have students pick and annotate only one isoform for each feature. • If more than one isoform exists, pick the largest or the one with the most exons • Here student should choose to annotate isoform A (largest) • All isoforms should be annotated eventually
Step 3: Investigate Exons • Given we need to annotate isoform A, we need exon sequence for exon 1 and 2, so we do BLASTX search • Click on [Peptideinfo] for isoform A on right just above map • Scroll down to find peptide sequence with exons in different colors: YNASSNKYSLINVSQSKNFPQLFNKKLSVQWINTVPIQSRQTRETRDIGLETKRHSKPSKRVDETRLKHLVLKGLGIKKLPDMRKVNISQAEYSSKYIEYLSRLRSNQEKGNSYFNNFMGASFTRDLHFLSITTNGFNDISNKRLRHRRSLKKINRLNQNPKKHQNYGDLLRGEQDTMNILLHFPLTNAQDANFHHDK
Step 3: Investigate Exons • Start with exon 1 • We will use a varient of the BLAST program, called blast2seq. This version compares two sequences instead of comparing a sequence to a database • Best to search entire fosmid DNA sequence (easier to keep track of positions) with the amino acid sequence of exon 1
Step 3: Investigate Exons • Create 3 tabs in Safari • In the first tab, go to the goose browser chr10 of virilis; click the DNA button, then click “get DNA” • In the second tab, go to www.ensembl.org and get the peptide sequence for the melanogaster mav gene • These first two tabs now have the two sequences you are going to compare • In the third tab go to NCBI blast page and click on “Align two sequences (bl2seq)”
Step 3: Investigate Exons • Copy and paste the genomic sequence from tab 1 into sequence box 1 of tab 3 • Copy and paste the peptide sequence of exon 1 from tab 2 into sequence box 2 • Since we are comparing a DNA sequence to a protein we need to run BLASTX • Turn off the filter • Leave other values at default for now • Click “align” button to run the comparison
Step 3: Investigate Exons • No significant homology found • Either the mav ortholog is not in this fosmid (unlikely given the original blastp hit) or this exon is not well conserved • Lets look for similarities of lower quality • Click the back button to go back to the bl2seq page • Change the expect value to 1000 and click align
Step 3: Investigate Exons • We have a weak alignment (50 identities and 94 similarities), but we have seen worse when comparing single exons from these two species • Notice the location of the hit (bases 16866 to 17504) and frame +3
Step 3: Investigate Exons • A similar search with exon 2 sequences gives a location of chr10:18476-19744 and frame +2 • For larger genes continue with each exon, searching with bl2seq (adjusting e cutoff if necessary) and noting location and frame of region of similarity
Step 4: Create Gene Model • Pick ATG (met) at start of gene, first met in frame with coding region of similarity (+3) • For each putative intron/exon boundary compare location of BLASTX result with gene finder results to locate exact first and last base of the exon and check that the intron starts with “GT” and ends with “AG” • Exons: 16515-17504; 18473-19744 • Intron GT and AG present
Step 4: Confirm Gene Model As a final check we need to create the putative mRNA, translate it and make sure the protein we get out is similar to expected: • Enter coordinates for each exon in browser • Click “DNA” button at top then “get DNA” • Copy the sequence into a text file • Repeat for each exon, adding DNA to file • Go to http://us.expasy.org/tools/dna.html • Enter your entire sequence, hit “Translate Sequence”; should get one long protein • Compare the protein sequence to ortholog using bl2seq
Step 4: confirm model (Future) • We have a web page under construction which will simplify confirmation • This web site will double check intron- exon boundaries, translate the putative message and create a data file suitable for uploading
Considerations • Some exons are very hard to find (small or non-conserved; keep increasing E value to find any hits (10,000,000 not unheard of) • Donor “GC” seen on rare occasions • We have seen one example where the only reasonable interpretation was that an intron had moved (out of about 70 genes) • Without est and expression data you may get stuck; use your best judgment
Gene Function • In addition to annotation of the genes we ask the students to look into the function of each gene and discuss what they found in their final paper on annotation • For genes in Drosophila the best source to begin your investigation into gene function is the drosophila online database called Flybase.
Flybase www.flybase.org flybase.bio.indiana.edu
Flybase gene info • Search for gene name • Will find links to info pages with many helpful references • Remember many genes have functions assigned based only on similarity data • This is especially true for anonymous genes “CG#####”. Take any functional assignment with large amounts of skepticism, consider it a guess at best