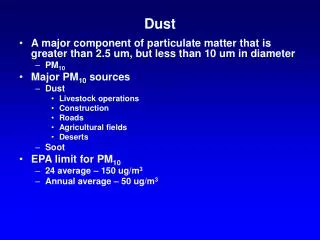
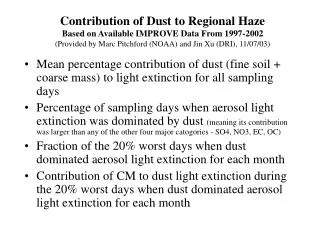
Download
1 / 33
330 likes | 428 Vues
Spatial variation of worst dust days (number shows the mean dust conc for WDD). Seasonal variation of worst dust days (# of WDD per season). April 16, 2001. September 07, 2001. September 07, 2001. September 07, 2001. October 16, 2001. June 07, 2002. June 07, 2002. June 07, 2002.

E N D
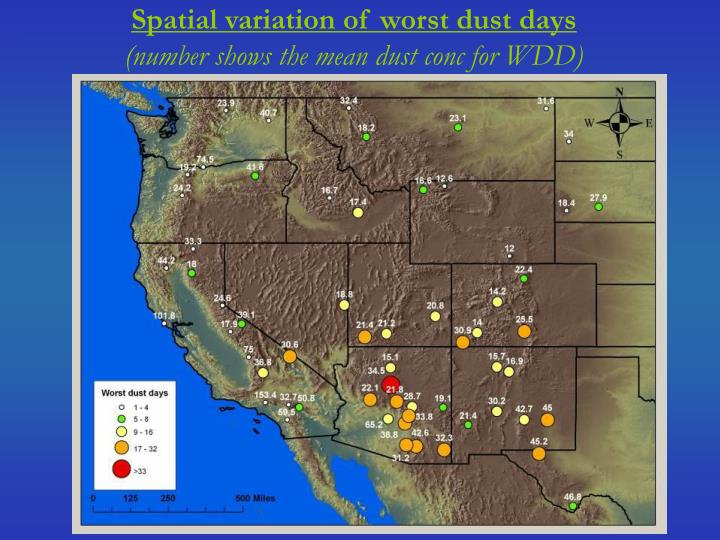
Spatial variation of worst dust days(number shows the mean dust conc for WDD)
Seasonal variation of determined and undetermined worst dust days
Arizona California Seasonal variation of determined and undetermined worst dust days for AZ and CA
WEB site development Description of the methodology On the basis of conceptual models for each site: Question 1: Is there a statistically significant relationship between dust mass and wind conditions ? (MLRA results) Question 2: What are the major events/sources of dust? (A table for each site and maps) Question 3: Are there, and to what extent, other undetermined sources? (A table for each site) Question 4: Are there any seasonal trends in the events/sources of dust? (maps) • Episode analysis: Choose episodes based on a combination of • season, month, year • site, state • event/source • confidence level A table and relevant maps for each episode
Future tasks • Characterize event types and scales of the events • Look at specific “regions” and analyze EHA results in context of season, regional-scale meteorology, topography • Utilize chemistry to differentiate between source types and regions (using EHA results) • Obtain activity data for agricultural activities and determine relationship with EHA results (e.g. if unexplained days in CA are due to almond harvesting) • Expand windblown dust analysis by using trajectory data where surface meteorological data are unavailable • Perform area source identification E.g. New Mexico Pilot Study (next presentation) • Verify the outcomes of EHA • Select specific WDD and obtain supplemental data (e.g. satellite, urban air monitoring, etc) to confirm/support EHA results