Download
1 / 13
130 likes | 229 Vues
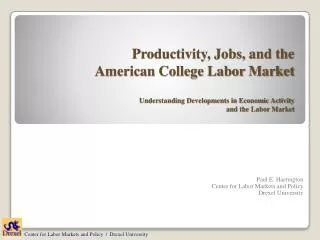
ECONOMIC & LABOR MARKET CHARACTERISTICS & PROJECTIONS. Pam Bodwell EVT 7066 Foundations of Career & Workforce Education University of South Florida October, 2008. US DEMOGRAPHICS.

E N D
ECONOMIC & LABOR MARKETCHARACTERISTICS & PROJECTIONS Pam Bodwell EVT 7066 Foundations of Career & Workforce Education University of South Florida October, 2008
US DEMOGRAPHICS • The US population is expected to increase by 21.8 million for the 2006-2016 period and over the next 50 years is expected to grow by nearly 50% to an estimated 394 million by the year 2050. The segment of the population which will increase the most is the age category between 55-64. The percentage of minorities and immigrants will rise with the highest increases to be seen in the populations of Asians and Hispanics.
US CIVILIAN LABOR FORCE1996, 2006 & Projected 2016 Percent Distribution Annual Growth rate (percent) • 2006 2016 1996- 2006- 2006 2016 Age, years: 16 to 24 15.8 14.8 12.7 .6 -.7 25 to 54 72.3 68.4 64.6 .7 .2 55 & older 11.9 16.8 22.7 4.8 3.9 Sex: Men 53.8 53.7 53.4 1.2 .8 Women 46.2 46.3 46.6 1.3 .9 Race: White 84.4 81.8 79.6 .9 .5 Black 11.3 11.4 12.3 1.4 1.5 Asian 4.3 4.4 5.3 1.7 2.7 Ethnicity: Hispanic Origin 9.5 13.7 16.4 4.9 2.7 Other than Hispanic 90.5 86.3 83.6 .8 .5 White non-Hispanic 75.3 69.1 64.6 .4 .1
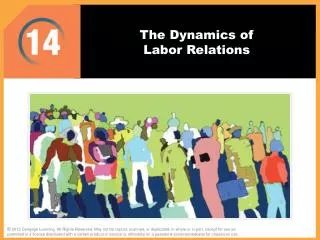
INDUSTRY EMPLOYMENT - SERVICE Growth projected to continue in service-providing sectors: • Professional & business services • Health care & social assistance Service –providing industries will generate almost all of the employment gain from 2006 to 2016 and will provide more than three-quarters of all jobs in 2016.
RESULTS OF AN AGING POPULATION • In terms of employment, the health care and social assistance sector is projected to have the most rapid growth in the economy, adding 4.0 million jobs by 2016, an annual growth rate of 2.4 percent!
INDUSTRY EMPLOYMENT - GOODS • Within the goods-producing sector, construction is the only sector projected to grow. Employment in manufacturing will decline by 1.5 million jobs. • Employment in goods-producing industries is expected to decrease from 14.9 to 13.1 percent of total employment
Top 5 industries with largest wage & salary employment growth, 2006-2016 Industry Employment Change 2006 2016 # % Mgmt., scientific &technical Consulting services 921 1,639 718 77.9 Employment Services 3,657 4,348 692 18.9 General medical & surgical hospitals, public and private 4,988 5,679 691 13.9 K-12 schools, public & private 8,346 8,983 638 7.6 Local government, excl. education & hospitals 5,594 6,206 612 10.9
Top 5 industries with largest wage & salary employment declines, 2006-2016 Industry Employment Change 2006 2016 # % Gasoline stations 861 716 -146 -16.9 Printing & related support activities 636 497 -139 -21.8 Motor vehicle parts manufacturing 654 516 -138 -21.1 Department Stores 1,551 1,438 -113 -7.3 Cut & Sew Apparel Manufacturing 186 77 -108 -58.4
INFORMATION The information sector is projected to experience output growth during the projection period, 2006-2016, faster than any other sector in the economy. Output in the information sector is expected to increase by $676.6 billion over the projected period, reaching $1.7 trillion in 2016. Most of this projected growth is expected in 3 industries: telecommunications, software publishing and Internet and other related services.
FAMILIES AND INCOME Despite the fact that the most recent economic expansion began in late 2001, the real income of the median family fell each year through 2004, the most recent available data. Between 2000 and 2004, real median family income fell by 3%, or about $1,600 in 2004 dollars.
401(k) – Empty Nest? • 1978 Section 401(k) of Congress's new tax code states employees can avoid taxes on income they receive as deferred payment • 1981 IRS allows employees to defer part of their pretax • 1984 >17,000 companies offer 401(k) plans among their retirement-savings options • 2001-02 Enron & WorldCom face lawsuits from employees whose 401(k)s were drained because of investments in company stock • 2008 Record market lows take a toll on retirement funds
EDUCATION, NO LONGER A LUXURY! Full-time workers age 25 and over without a high school diploma had median weekly earnings of $471, compared with $618 for high school graduates (no college) and $1,131 for those holding at least a bachelor’s degree. Among college graduates with advanced degrees (professional or master’s & above), the highest earning 10 percent of male workers made $3,192 or more per week, compared with $2,287 or more for their female counterparts. (3rd quarter, 2008)
REFERENCES U.S. Department of Labor, Bureau of Labor Statistics, www.bls.gov Figueroa, E., & Woods, R., Industry output and employment projections to 2016, Monthly Labor Review, November 2007. Economic Policy Institute, 2006-08 Fetini, A., A Brief History of: The 401(k), TIME, October 27, 2008.