Download
1 / 13
130 likes | 417 Vues
UNDERSTANDING BRAND SCHEMAS THROUGH BRAND CONCEPT MAPS. BRAND CONCEPT MAPS. Identifies Salient Brand Associations Individual maps are aggregated into consensus maps Method requires little experience or statistical techniques. Procedure for Constructing Brand Concept Maps.

E N D
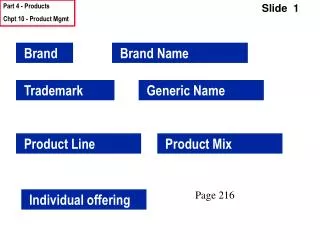
UNDERSTANDING BRAND SCHEMAS THROUGH BRAND CONCEPT MAPS
BRAND CONCEPT MAPS • Identifies Salient Brand Associations • Individual maps are aggregated into consensus maps • Method requires little experience or statistical techniques
Procedure for Constructing Brand Concept Maps I. Elicitation Stage • Solicit brand associations through open-ended questions about the brand • Select those that at least 50% of respondents mentioned • Write these associations on cards
Procedure for Constructing Brand Concept Maps II. Mapping Stage • Tell respondent to think about brand, look over cards & select relevant ones, add cards if needed • Explain BCM with an example, stressing significance of line types • Have respondent construct BCM for target brand, with target brand in middle
Procedure for Constructing Brand Concept Maps III. Aggregation Stage • Identify core brand associations (50% cutoff) • Identify first-order associations (ratio of first-order mentions/total mentions needs to be greater than 50% & superordinate > subordinate) • Remaining core brands are placed on the map linking them to first-order associations and all other links are made (ave. number of times each link mentioned across maps as cut-off) • For each link place lines (1-3) to signify intensity of connection (average number of lines respondents used to represent that linkage in their individual map)
Implication of Brand Schemas • Assess Positioning; strategy vis-a’-vis positioning • Brand Extensions • Schema-Consistent Inferences • Categorization
Schemas are not stored randomly Schemas are grouped into categories and linked to one another CONTENT vs. STRUCTURE
Implications of Categorization (attributional vs. relational) • Taxonomic vs. Goal Derived • Similarity • Impact of product/category knowledge • Context Dependency • Likelihood of retrieving alternative • Defines Competitors • Substitutes • Measuring market share • Things for breakfast vs. things for breakfast when on the run • Share-of-stomach measure
Implications of Categorization • Brand Evaluation • Expectations • Proximity to prototype • Category incongruency • Piecemeal vs. Schema-driven affect • New Beverage: Zippy • Carbonated • Coffee-flavored • Served cold • With or without milk
New Product Positioning ACHIEVING THE RIGHT “MIX” • Associate brand with appropriate category • Differentiate brand from other category members
Exemplar-Based Positioning Abstract-Based Positioning Soda Market: Coke Cereal Market: Crunchy Doesn’t get soggy in milk Daily amount of fiber Great taste New Product Positioning • ASSOCIATE YOUR BRAND TO WHAT??