Download
1 / 53
590 likes | 1.22k Vues
Bioinformatic Techniques & Tools for SNP Analysis. Jill L Wegrzyn Department of Plant Sciences University of California at Davis, Davis, CA 95616 USA E-mail: jlwegrzyn@ucdavis.edu. SNP Analysis Agenda. Sequence-Based SNP Identification Common Bioinformatic Solutions

E N D
Bioinformatic Techniques & Tools for SNP Analysis Jill L Wegrzyn Department of Plant Sciences University of California at Davis, Davis, CA 95616 USAE-mail: jlwegrzyn@ucdavis.edu
SNP Analysis Agenda Sequence-Based SNP Identification Common Bioinformatic Solutions Phred, Phrap, Consed, Polyphred, and Polybayes Re-Sequencing Project (ADEPT2) High-Throughput SNP Identification Solution (PineSAP)
mRNA cDNA Library BAC Library EST Overlap BAC Overlap Finding SNPs: Sequence-based SNP Mining Genomic RRS Library Random Shotgun DNA SEQUENCING Shotgun Overlap Align to Reference Sequence Overlap - SNP Discovery GTTACGCCAATACAGGATCCAGGAGATTACC GTTACGCCAATACAGCATCCAGGAGATTACC
Comprehensive SNP Discovery: Resequencing • Overlapping PCR Amplicons across entire gene • Make no assumptions about sequence function • Sequence diversity and genetic structure for each gene is different • Proper association studies can only be designed in this context • Complete resequencing facilitates population genetics methods
Sequence-based SNP Identification Sequence Phrap Phred Amplify DNA Base-calling Contig assembly Sequence each end Quality determination Final quality determination 5’ 3’ of the fragment. PolyPhred/Polybayes Polymorphism detection ATAGACGATACACG ATAGACGATACACG ATAGACG ATACACG Consed Sequence viewing Polymorphism tagging Analysis Polymorphism reporting Homozygotes Heterozygote Individual genotyping Phylogenetic analysis
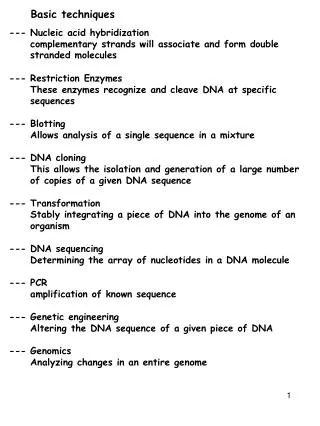
What is Phred/Phrap/Consed ? Phred/Phrap/Consed is a DNA sequence analysis package from University of Washington: • Trace file (chromatograms) reading • Quality (confidence) assignment to each individual base • Vector and repeat sequences identification and masking Sequence assembly • Assembly visualization and editing • Automatic finishing
Phred, Phrap, Consed, Polyphred, Polybayes • phred: Base calling and quality assignments • phrap: Contig formation and new quality assignments • consed: Visual X-Windows graphic interface, to view and edit alignments and contigs, and to view the original traces • polyphred: find polymorphisms in phrap contigs, quality calls, add data to phrap files to permit consed finding and visualization of polymorphisms. • polybayes: Fully probabilistic SNP detection algorithm that calculates the probability (SNP score) that discrepancies at a given location of a multiple alignment represent true sequence variations as opposed to sequencing errors.
Files and Program Execution • Input files: ABI chromat or SCF files • Order of Program execution: • phred, then phrap, then consed • or: phred, then phrap, then polyphred, polybayes, then consed • or: phred, then phrap, then consed, then polyphred, polybayes, then consed
What is Phred? Phred observes the base trace, makes base calls, and assigns qualityvalues (qv) of bases in the sequence. Writes base calls and qv to output files for Phrap assembly. Quality values (phred scores) range from 0 to 60. 20 and above is considered a confident base call (1 in 100 chance that is has been called wrong ~99% accuracy) Useful for consensus sequence construction ATGCATTC string1 CGTTCATGC string2 ATGC-TTCATGC superstring Here we have a mismatch ‘A’ and ‘G’, the qv will determine the dash in the superstring. The base with higher qv will replace the dash.
Phred value formula q = - 10 x log10 (p) where q - quality value p - estimated probability error for a base call Examples: q = 20 means p = 10-2 (1 error in 100 bases) q = 40 means p = 10-4 (1 error in 10,000 bases)
Why Phred? • Output sequence might contain errors. • Vector contamination • Dye-terminator reaction might not occur. • Weak or variable signal strength of peak corresponding to a base.
The structure of a phd file t 6 11908 a 6 11921 g 6 11927 t 6 11947 c 6 11953 a 6 11964 g 6 11981 c 4 11994 n 4 12015 c 4 12037 n 4 12044 n 4 12058 n 4 12071 n 4 12085 n 4 12098 n 4 12111 n 4 12124 c 4 12144 n 4 12151 END_DNA END_SEQUENCE t 16 8191 g 19 8200 t 13 8211 c 13 8229 g 4 8241 n 4 8253 c 4 8263 t 10 8276 t 9 8286 c 12 8301 t 16 8313 c 12 8329 c 12 8336 c 15 8343 t 19 8356 c 9 8371 g 13 8386 g 14 8397 a 7 8417 g 9 8427 g 4 8445 BEGIN_SEQUENCE 01EBV10201A02.g BEGIN_COMMENT CHROMAT_FILE: EBV10201A02.g ABI_THUMBPRINT: PHRED_VERSION: 0.990722.g CALL_METHOD: phred QUALITY_LEVELS:99 TIME: Thu May 24 00:18:58 2001 TRACE_ARRAY_MIN_INDEX: 0 TRACE_ARRAY_MAX_INDEX: 12153 TRIM: CHEM: term DYE: big END_COMMENT BEGIN_DNA t 8 5 c 13 17 a 19 26 c 19 32 t 24 2221 a 24 2232 a 22 2245 a 27 2261 g 25 2272 c 19 2286 c 12 2302 t 19 2314 g 12 2324 g 15 2331 g 19 2346 g 23 2363 t 33 2378 g 36 2390 c 44 2404 c 44 2419 t 39 2433 a 39 2446 a 34 2460 t 35 2470 g 34 2482
Phrap • Phrap constructs the contig sequence as a mosaic of the highest quality parts of the reads rather than a statistically computed “consensus”. • Avoids the complex algorithm issues associated with multiple alignment methods • Speed and accuracy • Phrap is an assembler NOT an aligner • The sequence produced by Phrap is quite accurate • Less than 1 error per 10 kb in typical datasets. • Phrap considers sequence quality at a given position (determined by Phred)
Running phredPhrap Construct directory structure • directory for the run, containing subdirectories chromat_dir, edit_dir, phd_dir, poly_dir Move tracefiles to directory chromat_dir Run phredPhrap from directory edit_dir • Determine phredPhrap parameters
The greater the forcelevel, the more liberal the assembly (generally produces fewer contigs). however results in more manual editing reviewing polymorphisms later Default Adjusting Parameters
Phrap output files • *.contigs– fasta file containing the contigs • Contigs with more than one read • Singletons (single reads with a match to some other contig but could not be merged consistently) • *.singlets–fasta file of the singlet reads • Reads with no match to other read • *.ace– for viewing the assembly w/ Consed • *.view – for viewing the assembly w/ Phrapview
Consed Consed is a program for viewing and editing assemblies produced by Phrap a. Assembly viewer - allows for visualization of contigs, assembly (aligned reads), quality values of reads and final sequence. b. Trace file viewer – single and multiple trace files can be visualized allowing for comparison of a given sequence in several reads. c. Navigation –identify and list regions which are below a given quality threshold, contain high quality discrepancies, single-strand coverage, etc.
Phred/Phrap/Consed Pipeline Directories: Chromat_dir Phd_dir Edit_dir
Using PolyPhred to Visualize SNPs • Compares sequences across traces obtained from different individuals to identify sites for SNPs. • Will occasionally miscall genotypes - frequency of such mistakes depends on the sequencing chemistry used to generate the trace. • To reduce the number of miscalled sites, ignores regions of poor quality & ends
Polyphred • polyphred -ace gene_file.ace.1 -tag p -snp hom -indel -f 50 > gene_file.polyphred.out • where gene_file.ace.1 is the .ace file present in the edit_dir directory. • Note: this command will give polymorphisms of quality 'ranks' 1 through 3: 1 is the highest quality, 6 is the lowest quality • The qualifier -f 50 is used to list 50bp of flanking sequence on each side of the detected polymorphism • The qualifier -indel is used to identify insertions or deletions • The qualifier -snp hom is used to identify homozygous SNPs only • The qualifier -tag p is used to list the tagged polymorphisms in the polyphred output file *.polyphred.out. • It first reads the ACE file to obtain the consensus sequence and the names of the trace (chromat) files used in the assembly. It then reads the PHD and POLY files associated with each trace.
Polyphred • Reads the ACE file to obtain the consensus sequence and the names of the trace (chromat) files used in the assembly. • Reads the PHD and POLY files associated with each trace. • During the SNP search phase, PolyPhred combines information from all of the sequence traces to derive a genotype and a score for each sequence • The score indicates how well the trace at the site matches the expected pattern for a SNP. • Updates the ACE and PHD files by adding tags that mark the positions of the sites. The tagged sites can then be examined using Consed.
Polybayes • Bayesian statistical model takes into account: • - depth of coverge • - base quality values of the sequences • a priori expected rate of polymorphic sites in region • Polybayes calculations are aided with information on major/minor allele frequencies as well as polymorphism rates within the species under investigation • **Can also integrate into the poly files for viewing with Consed
Allele Discovery of Economic Pine Traits • Goals • Re-sequence ~8,000 amplicons in Loblolly Pine • SNP Discovery • Genotyping of 3,000 trees using Illumina technology • Phenotyping of same 3,000 trees • Association studies
TreeGenes TreeGenes Resequencing Project Pipeline EST Databases (UGA, UMN) Diversity Panel DNA Extraction Megagametophyte Agencourt Sequencing 18 individuals & 5 other Assemble Contigs Primer Design Primer Validation Illumina Genotyping SNP Identication Phenotyping Drought, Dieases, & Wood Population DNA Extraction (Needles) Association Studies
Report to TreeGenes - several primers per amplicon will be stored in TreeGenes Successes - select 1 primer set per amplicon Primer synthesis at Illumina Report to TreeGenes Sequencing on validation DNA Successes BLASTing of validation DNA sequence back to EST database Report to TreeGenes Successes Sequencing of diversity panel - 1 primer set per amplicon which has been successful at each step Report to TreeGenes Primer Selection and Validation Primer Selection Using OSP primer picking
Alignment and SNP Calling PipelineChallenges in High-Throughput SNP Identification • Alignment Critical in the automation of base calls • Commonly used Phrap (from PhredPhrap) is an assembler and is NOT ideal for alignments • Many commonly used aligners work best with protein sequences or with a reference sequence • Preservation of quality scores for input into SNP identification programs • Speed for high-throughput programs • Automated SNP Calls • Reference Sequence Required • Traditional approaches without reference sequence include “eSNPs” (human, maize, and pine) -Very little redundancy outside of abundant genes -Overall high number of false positives (single pass reads) • Not specific to frequencies observed in different organisms • High number of false positives in currently accepted methods (Polybayes & Polyphred)
PineSAP Re-Sequencing data from Agencourt: Initial Processing Base Calling Sequence Alignment SNP Identification Machine Learning Data Storage & Release
Base Calling and Sequence Alignment Modified PhredPhrap allows for trimming of bases from start and end of sequence based on trace quality Ace2FASTA Converts native PhredPhrap output (ace file) into an unaligned FASTA file ProbconsRNA Optimal DNA sequence alignment program AlignedContig2ReadFASTA Provides single multifasta file with all reads aligned to the contig from PhredPhrap AND the contigs alignment to the other contigs from probconsRNA FASTA2Ace Converts resulting FASTA file back into ace file for SNP Identification
SNP Identification and Machine Learning Algorithms applied Independently for SNP Identification: Polyphred and Polybayes both utilize alignment and base quality information to identify potential polymorphisms. Both programs yield a high # of false positives Machine Learning Utilizes sequence based information and compares actual base calls to proposed calls to develop SNP identification filters specific to pine Parameters under Consideration: Local and global quality scores, frequencies of major and minor alleles, local and global SNP frequences, relative positions in sequence to existing variation, and polyphred and polybayes scores
SNP Identification Overview • Examine features to improve the accuracy of SNP location prediction • Utilize machine learning to apply the features • Refine the accuracy of the learning algorithm through adjustments to feature representation (iterative process) • Utilize the final classifier against the large re-sequenced set to improve accuracy of SNP calls originating from Polybayes and Polyphred
Feature Representation • Sequence depth • Count of number of sequences in the alignment at the position of variation. • All sequences in the alignment may not overlap at the position of variation; • number is different from the total number of the sequences in the alignment • Variation type • Variation type can be SNP or INDEL • PolyBayes score • PolyBayes program assigns a Bayesian posterior probability value for each called SNP using the frequency priors given for observing a variation at that position • Polyphred score • Polyphred assigns a score calculated primarily from sequence depth and quality score.
Feature Representation • Base frequencies • The number of occurrences of different bases at the position of variation is important in determining a polymorphic position. • Frequencies of the first (major allele) and the second (minor allele) are represented as ratio to sequence depth. • Relative distance • Sequence quality at the ends of the alignment tends to be poor due to inherent limitations of current sequencing technology. • SNP position was represented as the ratio of the distance in the consensus sequence from the closest end, or the relative distance
Feature Representation • Sequence quality • Variation is observed because of a poor quality base. • Based on the base frequencies calculated: • maximum qualities of the major and minor alleles • average qualities of major and minor alleles • Alignment quality • Misalignment of bases caused by sequence alignment programs sometimes result in an erroneous SNP call. • In the neighborhood of the SNP (+/- 10 bases) all the mismatches with the consensus sequence are given a penalty and the penalty is more if the mismatch is continuous
Classification Goal: Prediction Software: Decision tree C4.5 program is open-source C code (WEKA) • At each point in the construction of the decision tree, C4.5 selects the feature to test based on maximum information gain. • The goal is to generate a minimum size tree that correctly classifies all the elements in the training set. • The size of the tree is the number of nodes (decision nodes) and the number of leaves are the classes (categories) that they are distributed to.
Alignment and SNP Identification SNP Identification Datasets • Training set for loblolly pine was composed of a total of 300 validated sequences. • Divided to represent the relative percentages of sequence source • Testing set is composed of 120 validated sequence sets • Training set for poplar was composed of 42 validated sequences selected at random • Testing set is composed of a total of 30 validated sequence sets. • Validation = manually observed FP, FN, TP, and TN SNP calls through observation of tracefiles in Consed.
Alignment and SNP IdentificationEvaluation Criteria • Accuracy = (TP + TN)/total • Sensitivity = TP/(TP + FN) • Specificity = TN/(FP + TN)
Resulting Identifications • SNPs have been called using PineSAP on 7424 amplicons representing 6924 Unigenes. • Average amplicon length is 445 bp • Average of 5.5 SNPs/amplicons • Pine is highly polymorphic! • Total SNPS ~41,500 • Distribution of SNPs/amplicon • 1404 - 0 SNPs • 1133 - 1 SNP • 4887 - 2 or more SNPs
Alignment and SNP IdentificationSNP Formatting Custom lists can be exported into Illumina style input **option for adding IUPAC codes for SNPs in flanking sequence
Data Storage and Release SNP Identifcations GENOTYPING
SNP Discovery: dbSNP database dbSNP NCBI SNP database