Download
1 / 1
10 likes | 119 Vues
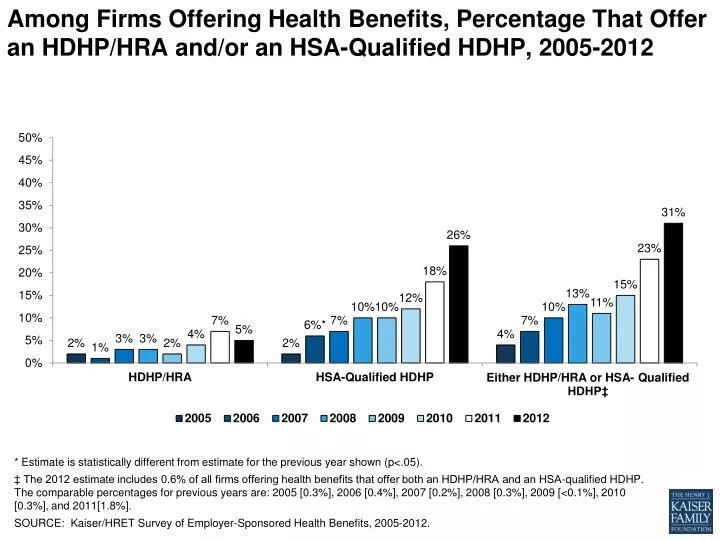
Among Firms Offering Health Benefits, Percentage That Offer an HDHP/HRA and/or an HSA-Qualified HDHP, 2005-2012. * Estimate is statistically different from estimate for the previous year shown (p<.05 ).

E N D
Among Firms Offering Health Benefits, Percentage That Offer an HDHP/HRA and/or an HSA-Qualified HDHP, 2005-2012 * Estimate is statistically different from estimate for the previous year shown (p<.05). ‡ The 2012 estimate includes 0.6% of all firms offering health benefits that offer both an HDHP/HRA and an HSA-qualified HDHP. The comparable percentages for previous years are: 2005 [0.3%], 2006 [0.4%], 2007 [0.2%], 2008 [0.3%], 2009 [<0.1%], 2010 [0.3%], and 2011[1.8%]. SOURCE: Kaiser/HRET Survey of Employer-Sponsored Health Benefits, 2005-2012.