Download
1 / 16
160 likes | 296 Vues
Characterization of aerosol types from MODIS-AIRS. Yan Zhang Nov. 08, 2012. Motivation Both CO and aerosols can be produced by incomplete combustion that occurs in biomass burning. CO could be a good indicator of smoke aerosols.

E N D
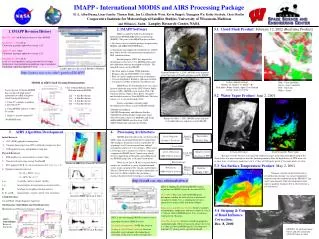
Characterization of aerosol types from MODIS-AIRS Yan Zhang Nov. 08, 2012
Motivation • Both CO and aerosols can be produced by incomplete combustion that occurs in biomass burning. CO could be a good indicator of smoke aerosols. • If we could use CO and aerosol properties from satellite measurements to characterize dust and smoke aerosol over equatorial Atlantic ocean? • Data • MODIS: The aerosol data used in this study are Aqua MODIS level 2 aerosol product data (MYD04). The accuracy of AOT is approximately 0.03 over ocean [Remer et al., 2005]. • AOD and FMF over Ocean • AIRS: The CO data used in this study are Aqua AIRS level 2 product data from JY Warner group. • CO
Smoke FMF • What do we expect for ideal case? • CO and aerosol only be produced by incomplete combustion from biomass burning. • What will make an ideal to not an ideal? • Removal processes: • CO: • Aerosol: wet and dry deposition • Life time • CO: ~2 months • Aerosol: ~ 1 week • Others: data quality Dust CO
6-day HYSPLIT backward trajectories ending at [9ºN, 15ºW] in the smoke-dominated regime and at [4ºN, 7.5ºW] in the dust-smoke mixed regime on January 31, 2008 1400UTC. The air mass arrived at both locations passed over the smoke-active Sahel region during the January 28-30 period. During the January 26-27 period, the air mass arriving at [4ºN, 7.5ºW] originated from the Bodèlè Depression – the major source of Saharan dust in the winter, whereas that arriving at [9ºN, 15ºW] drifted off north to the Bodèlè Depression and were influenced less by dust.
Qflag =3 Qflag =3
Criteria: • Qflag = 3; • AOD> 0.15 • Fcld<0.3 • Domain: Dust outflow region • lat_min= 17; • lat_max = 20; • lon_min = -24; • lon_max = -19;
N(lat) w(lon)
AERONET measurements from Capo-Verde 1996~2009 daily data, JJA, AOD> 0.4, SAZ>50; Thanks Dongchul Kim.
lat_min = 0; • lat_max = 20; • lon_min = -30; • lon_max = 0;
Color bar is FMF Color bar is AOD
Seeking Suggestion • How to understand FMF feature over dust outflow region? • What else we can do to link aerosol product and CO from satellites measurements?