Download

1 / 41
410 likes | 521 Vues
P14414 P3 Arborloo wind resistance test stand Detailed Design Review. Greg Hyde Raymond Zheng Joseph Rojano Katie Bentley Lori Liebman. Overview. Team Introductions Project Statement Functional Decomposition System Architecture Concepts Project Refocusing CFD Analysis

E N D
P14414P3 Arborloo wind resistance test standDetailed Design Review Greg Hyde Raymond Zheng Joseph Rojano Katie Bentley Lori Liebman
Overview • Team Introductions • Project Statement • Functional Decomposition • System Architecture • Concepts • Project Refocusing • CFD Analysis • ANSYS Analysis • Subsystems • Risk Analysis • Project Plan • Moving Forward • Summary
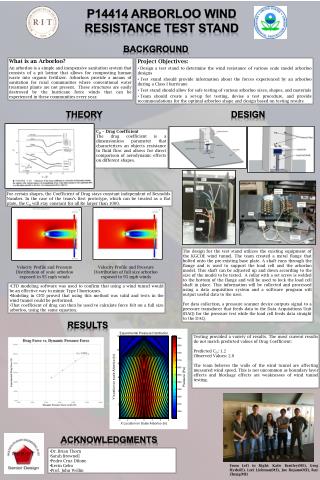
Project statement • Measure wind speed, forces, aerodynamic effects • Create test procedure for full size and scale testing • Recommendations for future design of arborloos The primary objective of this project is to design a scale model and a full-size test stand that will help determine the wind resistance of various arborloo designs. The scale model test stand should replicate the forces experienced by a Class I hurricane, and the results should be easily comparable to the lower speed, full-size results.
Concepts - RIT Wind Tunnel Scale Speeds – 1/6 Model Matching Reynolds Number • Required Wind Tunnel fluid speed: ~570 mph • Wind tunnel maximum fluid speed: ~120 mph • Using a model that’s 1/6th as small,Mimicked wind speed: ~20 mph • ~40 mph for a 1/3 model
Concepts - Tow tank hybrid 1/6 Scale • Required velocity of the system to be ~17.5m/s • Drag force would be ~11455.6 N • Required motor would need to be ~250hp 1/3 Scale • Required velocity of the system to be ~8.75 m/s • Drag force would be ~12124N • Required motor would need to be ~140hp • If v = 40mph, Vreq = 7.36m/s Fd = 2145N Preq = ~21hp • Maximum testable wind speeds would be around 50mph with a 30hp engine assuming 2m/s lazy river velocity
Scaling Laws • Dimensional Analysis – allows for identification of key parameters • Reynolds Number allows to determine model test velocity given a full size expected velocity • Drag Coefficient allows us to find the expected full size drag force given the model measured drag force
Reynolds Number - Importance • CD(Re) – Large Difference Laminar & Turbulent Flows • To make sure you have dynamic similitude you need to match Reynolds between model and full size so that CD is correct
Reynolds Number - Importance • For infinite plate with 2D flow, CDis actually constant over a vast range of Re • Can assume CD will always be constant at any velocity
Drag Coefficient- Importance “The drag coefficient for all objects with sharp edges is essentially independent of Reynolds number (for Re>1000)”
Project Refocusing • Because CD is constant for a flat plate at a large range of Reynolds Numbers, there is no need to match wind speed • No need to match Reynolds Number • Can obtain CD with low speed tests • With a constant wind velocity, area and fluid, the drag force can be calculated given CD
CFD Analysis • Created a simulation using COMSOL Multiphysics 4.3b • Turbulent Flow Parameters • Flow Characteristics • Pressure Distribution • 3 Models • 22-45 mins simulation time
1/6 Model at 95 mph CFD Analysis Top of arborloo
1/6 Model at 570 mph CFD Analysis Top of arborloo
1/6 Model at 95 mph CFD Analysis Middle of arborloo
1/6 Model at 570 mph CFD Analysis Middle of arborloo
1/6 Model at 95 mph CFD Analysis Bottom of arborloo
1/6 Model at 570 mph CFD Analysis Bottom of arborloo
1/6 Model at 95 mph CFD Analysis Pressure distribution over face of arborloo
1/6 Model at 570 mph CFD Analysis Pressure distribution over face of arborloo
ANSYS Analysis • Mechanical Deformation • SOLID 187 • Wood– E=9.03 GPA • Anisotropic Material • 1 inch thickness
Subsystems • Measuring Devices • DAQ + Data Processing • Attachments + Model
Subsystems – measuring devices • Pressure Sensors (Omega PXCPC-001GV ) • 5 sensors mounted on face of arborloo • Sensor range 1 kPa – 1000 kPa • Cost: $31 each
Subsystems – measuring devices • Pressure sensors will give general pressure distribution • Surface area of arborloo face is known • 1/6 scale: Area=18 in^2 • Average Pressure x Area = Distributed Force
Subsystems – measuring devices • Anemometer • 1 mounted next to arborloo (not obstructing air flow) • Cost: ~$250 each • Used to verify windspeed at arborloo
Subsystems – Daq + data processing • NI LabView • National Instruments program that the KGCOE has available for students • Provides tools that are needed to build measurement and control applications efficiently • An application can be made to analyze the data as it is being collected and projecting it in a useful format • Matlab or Excel • Data would be input manually after being stored on an external drive • Then data would be analyzed using the program applications • 2 options for Data acquisition and processing • Option 1: Real time analysis using LabView • Department equipment available to convert information from sensors to LabView compatible data • LabView code would analyze the data instantaneously • Option 2: External Storage and analysis using LabView, Excel or Matlab • Device can have an external storage that can be connected to a computer than analyzed in any program that the user desires • Data must be collected after each test and has a limit on data capacity
Subsystems – attachments + model • RIT Wind Tunnel • Model to be attached via stainless steel plate • Test Model will need to be about 1.5 ft tall max (1/6th scale)
Subsystems – attachments + model • Wind Tunnel Attachment Block • ¼” thru holes for attachment • Create adaptor that attaches to the block to simulate the posts of the arborloo in the ground
Moving forward Weeks 9-12 • Finalize Small Scale Design • Purchase Materials • Build Model Weeks 13-15 • Test Small Scale in Wind Tunnel • Design Full Scale Test
Overview • Team Introductions • Project Statement • Functional Decomposition • System Architecture • Concepts • Project Refocusing • CFD Analysis • ANSYS Analysis • Subsystems • Risk Analysis • Project Plan • Moving Forward