Download
1 / 41
410 likes | 512 Vues
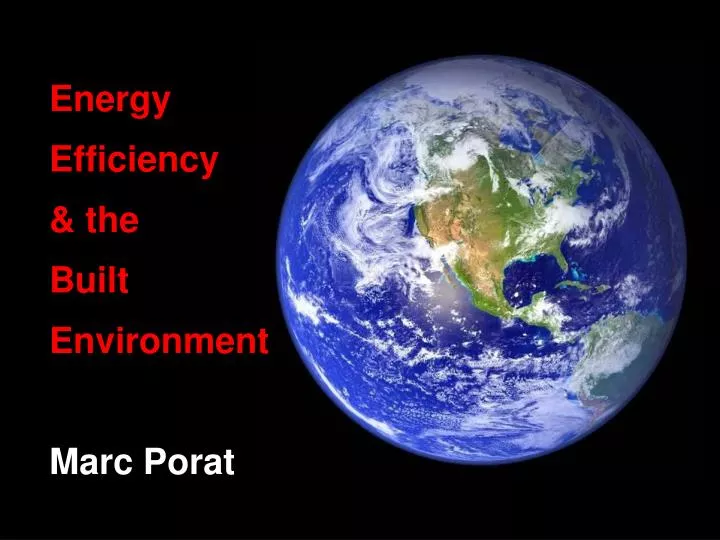
Energy Efficiency & the Built Environment Marc Porat. DALLAS. GUJARAT. DUBAI. SHANGHAI. The Built Environment. 51% Total U.S. energy. 55% Total U.S. CO 2. Source: “Potential Carbon Emissions Reductions In the Building Sector by 2030”, Brown, Stovall & Hughes, Oak Ridge National Lab.

E N D
The Built Environment 51% Total U.S. energy 55% Total U.S. CO2 Source: “Potential Carbon Emissions Reductions In the Building Sector by 2030”, Brown, Stovall & Hughes, Oak Ridge National Lab
U.S. Energy Demand 51% 27% 22% Built Environment Transport Industry Source: EIA, CalStar analysis
U.S. Energy Built Environment 51% Residential 22% Commercial 17% Operations 39% Buildings 9% Infra 3% Materials 12% Source: EIA, CalStar analysis
The Problem Food & Water 19% Light 18% Heat & Cool 38% Other 12% Appliances 13%
Energy Deficit Million Metric Ton Coal Equivalent BAU energy demand DEFICIT Peak Coal 2030-2035 Coal Demand Oil Hydro Wind Imports Coal Natural Gas Nuclear Solar, geothermal Source: Lawrence Berkeley National Lab, 2050 China Energy Study, preliminary estimates; do not cite
China Energy Demand 37% 50% 9% 6% Buildings Industry Transport Agr Source: LBNL
China Built Environment 37% total energy 52% total CO2 Source: “Potential Carbon Emissions Reductions In the Building Sector by 2030”, Brown, Stovall & Hughes, Oak Ridge National Lab
China Energy & Built Environment Built Environment 37% Residential 14% Commercial 9% Operations 23% Buildings 11% Infra 3% Materials 14% Source: EIA, CalStar analysis
Million Metric Ton Coal Equivalent Net Zero Buildings BAU energy demand SAVINGS NZE DEFICIT All other sources 2030 peak COAL Source: Lawrence Berkeley National Lab, 2050China Energy Study, preliminary estimates
McKinsey Study Sources: McKinsey & Co.
Built Environment = Negative Cost Cum Gt CO2 eliminated 50 €/t CO2 0.50 1.0 1.5 2.0 2.5 3.0 3.5 4.0 0 -50 Fridges / freezers Retrofit facade -100 Appliances Lighting A/C -150 Water heating Retrofit floor/roof Building envelope Heaters -200 Washers/ dryers Retrofit floor/ roof Windows Other appliances New-build insulation …green building materials & technologies Sources: Vattenfall, McKinsey & Co.
Next Generation - first new drywall in 91 years. 88% less embodied energy Much lower carbon footprint than gypsum drywall Mold resistant face Mold resistant core Termite resistant No mercury in production Cradle-to-Cradle Platinum 9 LEED points
Industry standard are R2 to R3 50% to 33% energy leak ThermaProof are R5 to R11 20% to 9% energy leak In USA, 3-7 year payback
Thermal Performance R value Insulated Walls ThermaProof Windows Windows
Cement Portland cement, 8% of CO2 2.8 billion tons in 2008 $150B world market No change since 1824
Automobiles ~ Cement 2.8 BT CO2 700M autos x 4T 2.6 BT CO2 2.8BT cement x 0.9T ~
CHINA 50% of world Cement 1.4 BT in 2008
Electric Buildings 50-100 watts per m2 North, South East, West 2-5 year payback
Evolution of Electric Buildings Rooftop Modules Curtain Walls Frosted, colored Architectural designs Attachments & networks Windows & Glass Doors Transparent (tinted) Micro-inverter in frame Toyota PAPI Dream House
ZETA Communities Zero Energy Technology & Architecture Affordable Multifamily Housing Net Zero Energy Factory Built
California AB-32 All new construction in California Net Zero Energy Commercial by 2030 Residential by 2020 USA Conference of Mayors Climate Protection Agreement. Kyoto protocol Commercial Building Initiative All buildings, new and old, carbon neutral by 2030 DoE Building America NZE for all American housing by 2020 2030 Challenge New buildings carbon neutral by 2030 Net Zero Energy Mandates
Solar thermal External Shading Daylighting Photovoltaics High-performance windows Air recirculation Ultra insulation Passive cool & heat Thermal recycling Heat pump Thermal mass Heat storage
China-USA Cooperation Two-way green trade • Design • Engineering & integration • Building materials • Building systems • Distributed energy, heat, water Qingdao EcoBlock UC Berkeley Institute of the Environment
China Green Xiamen EcoCity design competition
China Green • Adopt Net Zero Energy goals & policies • Increase building code compliance • Allow market price of energy to reflect its cost • Invest some of $586B stimulus in energy efficiency • Support international climate change agreements
Harmonious Society Danger path Green path
Energy Efficiency & the Built EnvironmentMake A DifferenceMarc Poratmporat@greencube.com