Download
1 / 16
170 likes | 362 Vues
Personal Financial Management . The hidden job retention skill. Who will benefit from this training?. Intensive service providers who work directly with long-term unemployed job seekers.

E N D
Personal Financial Management The hidden job retention skill
Who will benefit from this training? • Intensive service providers who work directly with long-term unemployed job seekers. • Understanding the effects of personal financial management on the job search process is vital to the task of helping job seekers reduce personal stress, maximize the amount of income currently earned, and allow job seekers an opportunity to develop skills that will last throughout the working career.
By the end of this training participants will be able to: • Develop a realistic spending plan using an example of an out of work job seeker. • Design a credit reduction management process for job seekers. • Explain the FICO algorithm and its effects on debt management. • Explain how to correct adverse actions on a credit report.
Spending Plan Review (budgeting) A cash-flow (or income and expense) Statement lists and summarizes income and expense transactions that have taken place over a specific period of time, such as a month or a year. It tells you where your money came from and where it went.
Debt to Gross income Ratio • The debt-to-income ratio (DIR) is calculated by dividing debt repayments by gross monthly income. • Debt to Gross Income (DIR)ratio = Debt ÷ Gross monthly income.
Debt Payments-to-Disposable Income Ratio • The debt payments-to-disposable income ratio (DDIR) divides monthly disposable personal income (not gross income) into monthly debt repayments (excluding mortgage debt). • Debt payments-to-disposable income ratio = monthly nonmortgage debt repayments ÷ disposable income.
Spending Plan review (budgeting) • A balance sheet (or net worth statement) describes an individual’s or family’s financial condition on a specified date (often January 1) by showing assets, liabilities, and net worth.
Spending Plan Review (budgeting) A balance sheet consists of three parts: assets, liabilities, and net worth. Assets include everything you own that has monetary value. Your liabilities are your debts – what you owe to others. Your net worth is the dollar amount left when what is owed is subtracted from the dollar value of what is owned – that is, when liabilities are subtracted from assets.
Asset-to-Debt Ratio • The asset-to-debt (liabilities) ratio compares total assets with total liabilities (debts). It provides you with a broad measure of your financial liquidity. The assets-to-debt ratio shows whether a client is technically solvent. • Asset-to-debt ratio = total assets ÷ total debt
Monetary Management • “Moving at the speed of life” • Debit Cards • Electronic banking • Interest earning checking accounts • Spending vs. Savings tools & pitfalls • Commercial vs. Credit Unions
Guidelines for major Purchases • Control Buying on Impulse • Pay Cash • Buy at the Right Time • Don’t Pay Extra for a “Name” • Recognize the High Price of Convenience
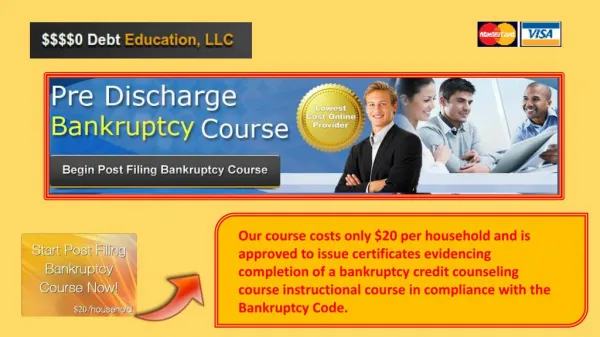
The Credit Card Dilemma • In order to profit from high interest rates, the credit card industry is dependent on users who don’t pay off their credit card balance each month. • Average credit card debt per household = $15, 956 • Average APR on credit card with a balance = 12.78% as of Nov. 2011 • As of December 2011, U.S. revolving consumer debt, 98% made up almost entirely of credit card debt, was about $801 Billion.
What is a Credit Score? • Credit scores are numerical calculations that are supposed to indicate the risk that you will default on your payments. High credit scores indicate less risk, lower numbers indicate potential problems.
The Three “c’s” • Capacity = the amount of debt you can realistically payback given your income. • Collateral = assets that can be taken in case you don’t pay your debt. • Character = objective factors that show stability.
Fair Isaac Corporation (FICO®) • Your payment history (about 35% of the score). • Length of your credit history (about 15% of the score). • Amounts you owe on credit accounts (about 30% of the score). • Your new credit (about 10% of the score). • Types of credit (about 10% of the score).