Download
1 / 35
350 likes | 577 Vues
Using Software to Collect Data Electronically for the Economic Census. Amy E. Anderson & M. Diane Harley Presented by: Shirin Ahmed U.S. Census Bureau. Outline. Background What is an Economic Census? The software Research Timeline Findings Challenges for the future.

E N D
Using Software to Collect Data Electronically for the Economic Census Amy E. Anderson & M. Diane Harley Presented by: Shirin Ahmed U.S. Census Bureau
Outline • Background • What is an Economic Census? • The software • Research • Timeline • Findings • Challenges for the future
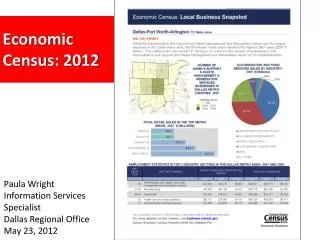
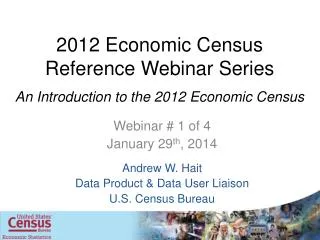
What is an Economic Census? • Largest collection of economic data from establishments in the U.S. • Provides benchmark measures for the U.S. economy • Main use is for the Gross Domestic Product (GDP) • Collected every 5 years • Modes: Paper or electronic • Includes over 500 form types based on industry classification
The Software: Surveyor • Windows based application • Downloadable • Internet • Business Help Site: www.census.gov/econhelp • Encrypted CD (when requested) • Also used to collect 3 surveys • Report of Organization (estab based) • Annual Survey of Manufactures (estab based) • Research and Development Survey (R&D) • Company based • Moving to the Web in the future
Other electronic reporting options • Census Taker = Web Application • Manufacturers’ Shipments, Inventories, and Order (M3) Survey (monthly) • Quarterly Financial Report (QFR) • Quarterly Services Survey (QSS) • Annual Retail Trade Survey (ARTS) • Annual Trade Survey (ATS) • Annual Capital Expenditures Survey (ACES) • Information and Communication Technology (ICT) Survey • Survey of Plant Capacity Utilization (SPCU)
The Surveyor Software:Additional Functionality • Exporting & Importing • Exporting • The software creates a spreadsheet containing location addresses and whatever data is within the software at the time of exporting • Columns per data field • Row per location • Exporting per form type • Importing • The software “imports" the spreadsheet back into Surveyor
Outline • Background • What is an Economic Census? • The software • Research • Timeline • Findings • Challenges for the future
Research Timeline • Early 2003 – Observational visits • 2002 Economic Census • Late 2003 – Debriefing interviews • 2004 / 2005 – Requirements gathering • In preparation for 2007 Economic Census • 2006 – Usability testing • Software prototype
Research Findings • Response Process Findings • (Requirements Gathering) • Major Design Changes (Usability Testing)
Response Process Findings • Task Analysis • How did you gather the data? • How are you searching your records? • Who did you work with? How? • How does the software assist / hinder with these tasks? • Evaluate the software against the tasks that R’s are doing • Results of that analysis assisted in the creation of prototypes for usability testing
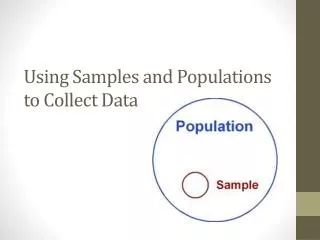
Response Process Findings:Use of Spreadsheets • Spreadsheets are an important tool during an economic census • Spreadsheets are used to: • Compare data • Gather data • Consolidate data • Verify data
Response Process Findings:Use of Spreadsheets cont. • Compare Data • Prior to gathering data, R’s will compare our list of locations to their list of locations • Identify newly closed or opened locations • Identify mis-matched locations due to typographical differences
Response Process Findings:Use of Spreadsheets cont. • Gather Data • Few respondents have access to all of the necessary data to complete an economic census form • R’s use spreadsheets to gather data from other employees
Response Process Findings:Use of Spreadsheets cont. • Consolidate Data • Once the data is gathered, sometimes in pieces, it is then merged together onto one consolidated spreadsheet
Response Process Findings:Use of Spreadsheets cont. • Verify Data • Once data gathering is complete, R’s sometimes compare reported data to aggregate company totals available in balance sheets and income statements to verify that the data is correct
Research Findings • Response Process Findings • (Requirements Gathering) • Major Design Changes (Usability Testing) #1 New screens were added #2 Overhaul of exporting / importing feature #3 Redesigned Inbox View
Design Change #1: New Screens Were Added • Workbook View
Design Change #1: New Screens Were Added cont. • Workbook View • Respondents wanted a correctable “quick view” of their data • Very well received by respondents • Large companies • facilitate exporting/importing functionality • “eyeball” their imported data • make quick data changes • Medium/small companies • faster data entry • “like using a spreadsheet without having to export”
Design Change #1: New Screens Were Added cont. • Error and Warning View
Design Change #1: New Screens Were Added cont. • Error and Warning View • In the past, R’s could only view errors / warnings form by form • Now they can view all errors/warnings at one time • “eyeball” errors/warnings within ALL forms • sorting allows respondents to pick how they want to resolve their edits (by location or by type of edit) • Very well received by respondents
Design Change #2:Overhaul of Exporting / Importing Feature • Flexible exported spreadsheets 2002: R’s could not move or delete rows or columns 2007: R’s can customize by deleting or moving columns
Design Change #2:Overhaul of Exporting / Importing Feature cont. • Informative exported spreadsheets 2002 • Spreadsheets had one-word (sometimes cryptic) column title 2007 • More information within the column to help R’s answer each field • Welcome screen • Basic information on how to fill out the spreadsheet • Where to go for more help
Design Change #3:Redesigned Inbox View • Identified and eliminated columns that weren’t useful, or were troublesome • Reordered columns to help emphasize more important ones • Example: errors and warnings were moved to a more prominent position • Added and updated customization options based on response process findings
Outline • Background • What is an Economic Census? • The software • Research • Timeline • Findings • Challenges for the future
Challenges for the future • Working with R’s who are restricted from downloading software (including Surveyor) onto their work PCs • Helping companies with diverse response processes use Surveyor • Using our Account Manager Program to help work with these diverse companies • Giving ‘tips’ in our mail out package, instructions, Business Help Site, etc.
Challenges for the future cont. • Meeting the needs of single-establishment respondents • Possibly offering single-establishment companies the option of reporting on the Web for 2012
Using Software to Collect Data Electronically for the Economic Census Questions Amy E. Anderson amy.e.anderson@census.gov 301-763-7544 U.S. Census Bureau