Download

1 / 15
150 likes | 320 Vues
Fond du Lac. Lisa Simonson Grant Nelson Brittany Dummer Emily Ripley Michealla Fischer. History.

E N D
Fond du Lac Lisa Simonson Grant Nelson Brittany Dummer Emily Ripley Michealla Fischer
History • The Anishinaabeg (an Ojibwa/Chippewa word meaning ‘The People’) of the Fond du Lac Reservation are primarily members of the Lake Superior Band of Minnesota Chippewa. The Chippewa Nation is the second largest ethnic group of Indians in the United States.”
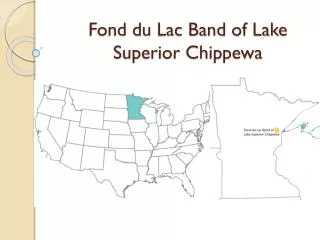
Ojibwa moved West and came to Great Lakes • Split at Sault Ste. Maria. Some came to Michigan, Wisconsin, Minnesota • Hunter-gatherers, traditions • Totemic system – families have totems • Europeans enter – LaPointe Treaty created Fond du Lac Reservation
Government • Chairperson • One representative from each of the three districts • Secretary/Treasurer • Four-year staggering terms
Social Constructs • Race – mascots, seen as lazy • Social Class – many are unemployed • Gender – boys taught to hunt and fish, while girls learn domestic skills • Sexual Orientation – “Two-Spirited” people, become more accepted • Exceptionality – differences create harmony
Discrimination • Discrimination Laws – no one can be denied access to the District or be denied benefits
Achievement Gaps • Native Americans in all grades are demonstrating proficiency at an average of 20% less than their Caucasian peers. http://w20.education.state.mn.us/MDEAnalytics/Reports.jsp
Teaching Techniques • Get to know students • Look at resources like the Minnesota Department of Education curriculum
Demographics • Household size: About 51 percent of American Indian/Alaska Native families with children were headed by married couples in 2006. This percentage was smaller than those of White, Hispanic, and Asian/Pacific Islander families having this arrangement but larger than the percentage of Black families. • Median age of household members:In 2006, the median age for American Indians/ Alaska Natives, including those of Hispanic ethnicity, was 31 years, compared to 36 years for the general population. • Educational attainment: In 2007, some 13 percent of American Indians/Alaska Natives 25 years or older held a bachelor's or graduate degree. • Employment status: In 2007, some 12 percent of American Indians/Alaska Natives ages 16 and over were unemployed
Demographics Continued • Income levels: In 2006, the median income of American Indian/Alaska Native households was lower than that of households in the total population; $34,800. • Socioeconomic status: In 2006, the poverty rate among American Indian/Alaska Native familieswith children under 18 (30 percent) was higher than that among all families with children under 18 (15 percent). • Residency patterns: In 2006, there were 4.5 million American Indians/Alaska Natives estimated in the United States, representing 1.5 percent of the total U.S. population. • Health indicators: In 2006, some 21 percent of American Indian/Alaska Native children between the ages of 12 and 17 had used alcohol in the past month. A higher percentage of American Indian/Alaska Native children had smoked cigarettes in the past month than children of any other racial/ethnic group.
Significance • Poverty and unemployment affect learning
NCES Academic Indicators • Reading: In 2007, American Indian/Alaska Native students in grades 4 and 8 scored lower than White and Asian/ Pacific Islander students on NAEP reading assessments. • Math: In 2007, American Indian/Alaska Native 4th- and 8th-graders scored lower than Whites and Asians/Pacific Islanders in NAEP mathematics, but higher than Blacks. • Suspension and expulsion rates:Seven percent of American Indian/Alaska Native public school students in kindergarten through 12th grade were suspended in 2004 • Expulsion rates were similar between American Indians/Alaska Natives and all other racial/ethnic groups in 2004—below 1 percent each.
Indicators Continued • Dropout rates: In 2006, a higher percentage of noninstitutionalized American Indian/Alaska Native young adults (ages 16 to 24) were status dropouts than were their White, Black, Asian, and Native Hawaiian/Pacific Islander peers. • Graduation rates: Seventy-five percent of American Indians/Alaska Natives who had been sophomores in 2002 reported that they had received a high school diploma by 2006, compared to 91 percent of Whites and 93 percent of Asian/Pacific Islanders • Rates of college attendance and completion: Enrollment of American Indian/Alaska Native students in colleges and universities more than doubled in the past 30 years. In 2006, American Indian/Alaska Native students accounted for 1 percent of total enrollment in colleges and universities.
Significance • There is an academic achievement gap • Teaching needs to be relevant and related to their culture and life
Resources • http://mn.gov/indianaffairs/tribes_fonddulac.html • http://www.fdlrez.com/ • http://www.fdlrez.com/tribalhistory.htm • National Museum of Native American, Smithsonian Museum • Library of Congress LOC.gov • http://www.fonddulac.k12.wi.us/inner.iml?mdl=policy.mdl • http://www.education.com/schoolfinder/us/minnesota/cloquet/fond-du-lac-ojibwe-school/#overview • (reasons for high dropout rates) http://jan.ucc.nau.edu/jar/AIE/Dropouts.html