Download
1 / 67
720 likes | 1.03k Vues
Chapter 2, Key Issue 1 – Where Is the World ’ s Population Distributed?. Population Concentration. Approx. 2/3 of the worlds population is clustered in four regions: East Asia, South Asia, Southeast Asia, and Western Europe Similarities of four regions:

E N D
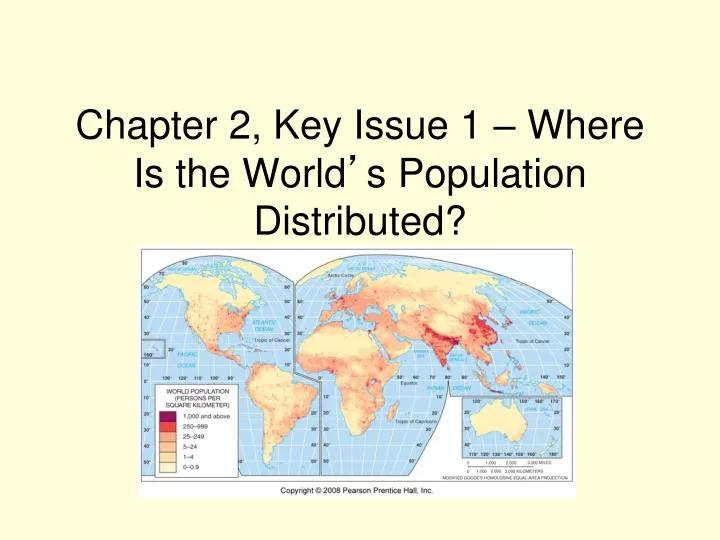
Chapter 2, Key Issue 1 – Where Is the World’s Population Distributed?
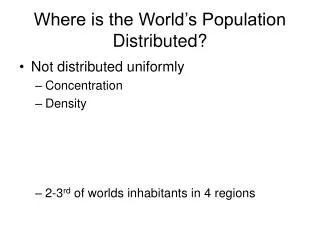
Population Concentration • Approx. 2/3 of the worlds population is clustered in four regions: East Asia, South Asia, Southeast Asia, and Western Europe • Similarities of four regions: • Most people live near an ocean or near a river with easy access to an ocean • Clusters occupy low-lying areas, with fertile soil and temperate climate
World Population Cartogram Fig. 2-1: This cartogram displays countries by the size of their population rather than their land area. (Only countries with 50 million or more people are named.)
East Asia • 1/5 of world’s population live in East Asia • 5/6 of the people in this concentration live in the People’s Republic of China (most populated country in world) • Chinese pop. is clustered near Pacific Coast and in several fertile river valleys • 3/4 of people live in rural areas where they work as farmers • Japan and South Korea, population is not distributed uniformly • More than three-fourths of people live in urban areas
South Asia • Second largest concentration of people • India second most populated country (more 3/4 of South Asian population concentration) • Much of India’s population is concentrated along plains of Indus and Ganges rivers • Population also concentrated near India’s two long coastlines • Most people in South Asia are farmers
Southeast Asia • World’s fourth largest population cluster which is mostly concentrated on a series of islands • Indonesia consists of 13,677 islands and is the world’s fourth most populous country • A high percentage of people in Southeast Asia work as farmers • The 3 Asian population concentrations comprise over half of the world’s total population, but together they live on less than 10% of Earth’s land area
Europe • Western Europe, Eastern Europe, and European portion of Russia forms world’s third-largest population cluster • 3/4 of Europe’s inhabitants live in cities • Import food and other resources • Search for additional resources was a major incentive for Europeans to colonize other parts of the world during the previous six centuries
Other Population Clusters • Largest population cluster in Western Hemisphere is in northeastern U.S. and southeastern Canada • 2% of world population lives in this area • Less than 5% are farmers • Another 2% of world’s population is clustered in West Africa • Approximately half is in Nigeria (other half spread over countries west of Nigeria) • Most people work in agriculture
Sparsely Populated Regions • Relatively few people live in regions that are too dry, too wet, too cold or too mountainous • Three-fourths of world’s population lives on only 5% of Earth’s surface • Ecumene – portion of Earth’s surface occupied by permanent human settlement
Expansion of the Ecumene5000 B.C.–A.D. 1900 Fig. 2-3: The ecumene, or the portion of the Earth with permanent human settlement, has expanded to cover most of the world’s land area.
Dry Lands • Areas too for farming cover 20% of Earth’s land surface • Deserts generally lack sufficient water to grow crops… although some people survive by raising animals (i.e. camels) • Dry lands can contain natural resources (i.e. oil reserves)
Wet Lands • Lands that receive high levels of precipitation may also be inhospitable for humans • Primarily located near equator • Combo of rain and heat rapidly deplete soil nutrients • In seasonally wet lands, such as Southeast Asia, enough food can be grown to support a large population
Cold Lands • Much land near North and South poles is perpetually covered with ice or the ground is permanently frozen (permafrost) • Few animals can survive in these regions, and few humans live there
High Lands • Relatively few people live at high elevations • Exceptions: Latin America and Africa
Population Density • The number of people occupying an area of land, can be computed in several ways, including arithmetic density, physiological density, and agricultural density
Arithmetic Density • Arithmetic density (population density) is the total number of people divided by total land area • Enables geographers to make approximate comparisons of the number of people trying to live on a given piece of land in different regions of the world
Physiological Density • A more meaningful population measure is afforded by looking at the number of people per area of certain type of land in a region • Arable land – land suited for agriculture • The number of people supported by a unit of arable land is called physiological density • Comparing physiological and arithmetic density helps geographers to understand capacity of land to yield enough food for the needs of people
Agricultural Density • Agricultural density – ratio of number of farmers to the amount of arable land • To understand relationship between population and resources in a country, geographers examine its physiological and agricultural densities together
The world’s largest concentration of people is located in • East Asia • South Asia • Southeast Asia • Western Europe • The most populous country in the world is • Indonesia • China • Russia • India
Relatively few people live at high elevations, but there are significant exceptions, especially in • Asia • Europe • Latin America • North America • A country with a large amount of arable land and a small number of farmers will have a • High physiological density • Low physiological density • High agricultural density • Low agricultural density
Chapter 2, Key Issue 2 – Where Has the World’s Population Increased?
Three measures of population change: • Crude Birth Rate (CBR)- Total number of births in a year for every 1,000 people alive in a society • Crude Death Rate (CDR)- Total number of deaths in a year for every 1,000 people alive in a society • Natural Increase Rate (NIR)- Percentage a population is growing each year. CBR-CDR/1000
Natural Increase • The world’s NIR is about 1.3 percent or 80 million people per year • The rate of natural increase also affects the doubling time, or number of years needed to double a population. • At current rates the world population will double again in 54 years • Almost all of the world’s natural increase is centered in less developed countries • NIR rates in Europe are actually negative, while Asia, Africa, Latin America, and the Middle East are growing quickly
Fertility • Total Fertility Rate (TFR) is used to measure the number of births in a society. • This is the average number of births a woman will have through her child-bearing years (15 through 49) • The average world TFR is 3, though it exceeds six in some African countries and is less than 2 in Europe
Mortality • Infant Mortality Rate (IMR) is the annual number of deaths of infants under one year of age compared to total live births. Number of deaths per 1000 births • The highest IMR rates are in Sub-Saharan Africa and the lowest rates are in Western Europe • IMR is a reflection of how good the health care system is in a country
Life expectancy measures the number of years a newborn child can expect to live • Babies born today in Western Europe can be expected to live into their late 70’s, early 30’s in Africa • CBR, NIR, TFR and IMR can all be used as predictors of a country’s development
Chapter 2, Key Issue 3 – Why Is Population Increasing at Different Rates in Different Countries?
The Demographic Transition • While population rates vary among countries, a similar process of change is operating, known as the demographic transition • 4 stages in demographic transition • Barring catastrophe such as nuclear war it is irreversible
The Demographic Transition Fig. 2-13: The demographic transition consists of four stages, which move from high birth and death rates, to declines first in birth rates then in death rates, and finally to a stage of low birth and death rates. Population growth is most rapid in the second stage.
Stage 1: Low Growth • Most of humanity’s several hundred-thousand-year occupancy of Earth was characterized by stage 1 • CBR and CDR varied considerably from one year to the next and from one region to another, but over the long term they were roughly comparable, at very high levels • Between 8000 B.C. and 1750 A.D., Earth’s human population increased from approximately 5 million to 800 million.
Pop. growth around 8000 B.C. was caused by agricultural revolution • Despite agricultural revolution, the human population remained in stage 1 of demographic transition because food supplies were still unpredictable
Stage 2: High Growth • Around 1750 A.D. the world’s population suddenly began to grow 10 times faster than in the past • In stage 2, the CDR suddenly plummets, while CBR remains the same as in stage 1 • Some demographers divide stage 2 into two parts • During second part growth rates begin to slow, although gap between births and deaths remains high • Countries entered stage 2 after 1750 as result of Industrial Revolution
Unprecedented level of wealth, which was used to make communities healthier places to live • Countries in Europe and North America entered stage 2 around 1800, but not to most countries in Africa, Asia, and Latin America until 1950 • Late twentieth century push of countries into stage 2 was caused by medical revolution
Stage 3: Moderate Growth • Stage 3 occurs when CBR begins to drop sharply • European and North American countries moved from stage 2 to 3 during first half of 20th century • Most countries in Asia and Latin America have moved to stage 3 in recent years • Most African countries remain in stage 2
Countries enter stage 3 when people have fewer children • Economic changes in stage 3 societies also induce people to have fewer offspring • Farmers consider a large family an asset • Children in cities are not generally economic assets
Stage 4: Low Growth • CBR declines to point where it equals CDR, known as Zero Population Growth (ZPG) • TFR that results in a lack of change in total population over a long term • A TFR of 2.1 produces ZPG, although countries receiving many immigrants may need lower TFR to achieve ZPG • Most European countries have reached stage 4 • U.S. is slightly below ZPG since 2000
Changes in lifestyle encourage smaller families • Several Eastern European countries, most notably Russia, have negative natural increase rates… a legacy of Communist rule • As memories of Communist era fade, Eastern Europeans may display CBRs and CDRs comparable to Western Europe • Demographers may identify a 5th stage of demographic transition model characterized by higher CDRs than CBRs and an irreversible population decline
Population Pyramids • Population in a country is influenced by demographic transition in two ways: • Percentage of population in each age group • Distribution of males and females • Population info can be displayed by age and gender groups on bar graphs called population pyramids
Population Pyramids in U.S. Cities Fig. 2-16: Population pyramids can vary greatly, with different fertility rates (Laredo vs. Honolulu), or among military bases (Unalaska), college towns (Lawrence), and retirement communities (Naples).
Age Distribution • Dependency ratio – number of people who are too young or too old to work (compared to people in productive years) • Young dependents outnumber elderly by 10:1 in stage 2 countries, but number of young to elderly are nearly equal in stage 4 countries • Large percentage of children in stage 2 countries strains the ability of poorer countries to provide needed services
As countries pass through stages of demographic transition, the percentage of elderly people increases • More than ¼ of all gov’t expenditures in the U.S., Canada, Japan, and many European countries go to Social Security, healthcare, and other programs for the elderly
Retirement communities have higher percentage of women, because they have longer life expectancies • Shape of pop. pyramid tells a lot about a community’s distinctive character • Different shapes result from differences in ethnic composition
Sex Ratio • Sex ratio – number of males per hundred females in the population • In Europe and North America the ratio of men to women is about 95:100 (102:100 in rest of world) • High mortality rate during child birth partly explains the lower percentage of women • Societies with high rate of immigration typically have more males than females
Chapter 2, Key Issue 4 – Why Might the World Face an Overpopulation Problem?
Malthus on Overpopulation • English economist Thomas Malthus (1766-1834) was one of the first to argue that world’s population increase was far outrunning the development of food supplies
Population Growth vs. Food Supply • In An Essay on the Principle of Population Malthus claimed that population increased geometrically, while food supplies increased arithmetically • Population growth would strain resources in every country, unless “moral restraint” produced lower CBR or disease, famine, war, or other disasters produced higher CDR
Neo-Malthusians • Unprecedented NIRs in LDCs is causing contemporary geographers to revisit Malthus’s theory – Neo-Malthusians • They paint a frightening picture of world in which billions of people are engaged in a desperate search for food and fuel • Many LDCs have expanded food production in recent years, but have more poor people than ever before