Download
1 / 14
140 likes | 262 Vues
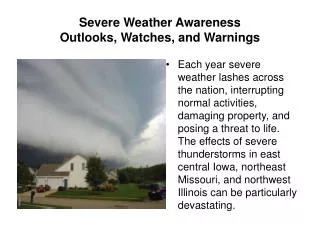
Using GIS to Enhance Impact-Based Weather Warnings. Evan Webb NOAA/National Weather Service Forecast Office Grand Rapids, MI. Outline. Objectives Starting Point: Winter 2013-2014 NWS Grand Rapids Impact Graphic Winter Storm Impact Index (WSII) – NWS Burlington, VT Role of GIS

E N D
Using GIS to Enhance Impact-Based Weather Warnings Evan Webb NOAA/National Weather Service Forecast Office Grand Rapids, MI
Outline • Objectives • Starting Point: Winter 2013-2014 NWS Grand Rapids Impact Graphic • Winter Storm Impact Index (WSII) – NWS Burlington, VT • Role of GIS • Further Development www.weather.gov/grandrapids
Objectives • Implement 5 color risk-based alert system to provide intuitive, consistent long-fused weather hazard information • Leverage Geographic Information Systems (GIS) to integrate NWS gridded forecasts with other data sets to assess community hazard exposure and potential impacts • Other Data Sets? • Land Use • Population Density • Infrastructure (Hospitals, Interstates, Schools, etc.) • Climatology • Provide more objective, scientifically-based starting point for potential weather impacts www.weather.gov/grandrapids
Impact graphic – wfo grand rapids • Winter 2013-2014 Prototype • First populated with snowfall forecast • Hand-edited • Subjective Created March 1, 2014 www.weather.gov/grandrapids
WSII – wfo Burlington, VT WSII Components: • Snow Load Index • Snow Amount Index • Uses maximum impact of either snow amounts or snow rate • Sperry-Piltz Ice Index • Blowing Snow Index • Factors include wind gusts, snow amounts, snow ratios, land use www.weather.gov/grandrapids
March 1, 2014 expected impacts www.weather.gov/grandrapids
March 1, 2014 Observed snowfall www.weather.gov/grandrapids
Expected impacts vs. observed snowfall March 1, 2014 Snowfall Summary: http://www.crh.noaa.gov/images/grr/presentations/March_1_Snowfall_Summary_Revised_2014-03-02_15-38-52.pdf www.weather.gov/grandrapids
Role of gis • Employ GIS and Python scripts to automate processing of algorithms/impact graphic creation • Several scripts automate procedure of downloading National Digital Forecast Database grids • Algorithms classify weather elements and modify values based on climatology, land use, etc. NCDC Snowfall Climatology www.weather.gov/grandrapids
Blowing snow index – wfoburlington, vt • Attempts to forecast where blowing snow could impact travel (6 hour wind gust reclassified) x (6 hour snow ratio) x ( 6 hour snow amount) x Land Use factor Maximum wind gust calculated every 6 hours Reclassified to the following based on least amount of friction (Plains): 1 = 0 - 15 2 = 15 - 19 3 = 19 - 23 4 = 23 - 27 5 = 27 - 31 6 = 31 - 35 7 = 35 - 40 8 = 40 - 45 9 = 45 - 50 10 = > 50 www.weather.gov/grandrapids
5 (100%)Low Friction WaterPerennial ice Bare rock/sandRow cropsSmall grainsFallowPastureGrassland 1 (10%)High Friction 2 (25%) 4 (75%) High intensity residentialCommercial/industrialQuarriesHerbaceous wetlands Deciduous forestEvergreen forestMixed forestWoody wetland 3 (50%) ShrublandTransitionalUrban grass Low intensity residentialOrchards/vineyards www.weather.gov/grandrapids
Sperry-piltz ice index • The SPIA Index was developed to provide decision support to emergency management officials, utility companies and the public during the hours and days leading up to an ice storm. The index quantifies the potential for electrical interruptions, and thereby gives more tangible information to the public concerning the extent of preparations thought necessary. www.weather.gov/grandrapids
Summary / Future work • Use GIS to derive impact level forecast • Meteorological variables • Land Use • Population Density • Infrastructure • Deciduous Tree Leaf-out • Pre-storm conditions • Ground temps, soil moisture, etc. • Continued collaboration with NWS Burlington, VT to calibrate algorithms • Communicating the meteorological threat info is key • GIS-based impact index could improve decision support to all partners, including the public • Use GIS to more accurately predict impacts and communicate them more effectively • Appropriate response in preparation • Saves lives • Saves money www.weather.gov/grandrapids