Download
1 / 16
160 likes | 348 Vues
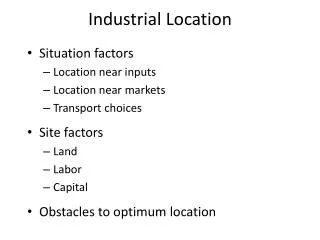
Industrial Location. Chapter 4. Three Isoquants. Isocost curve. Slope of isoquant. For a production function with two inputs, Along an isoquant, the change in output is zero, so Therefore,. Equilibrium for a Firm. Slope of Isoquant = Slope of Isocost or.

E N D
Industrial Location Chapter 4 1
Slope of isoquant • For a production function with two inputs, • Along an isoquant, the change in output is zero, so • Therefore, 4
Equilibrium for a Firm • Slope of Isoquant = Slope of Isocost or 5
Isocost curve and isoquant map showing a firm’s equilibrium 6
Pine Grove Boughs:$150 per load Wages:$400 / week Urban Center Boughs:$250 per load Wages:$200 / week Pine Grove vs Urban Center 8
Pine Grove For $1,000, the firm makes 300 wreaths per week, and Uses 5.253 loads of pine and 0.53 units of labor TC = $1,000 = ($150 5.253) + ($400 0.53). For $2,000, the firm makes 800 wreaths per week, and Uses 8 loads of pine and 2 units of labor TC = 2,000 = ($150 8) + ($400 2) Urban Center For $2,000 the firm makes 800 wreaths per week, and Uses 4.4 loads of pine and 4.5 units of labor TC = $2,000 = ($250 4.4) + ($200 4.5). For $3,000, the firm makes 1,500 wreaths per week, and Uses 5.6 loads of pine and 8 full-time workers. TC = $3,000 = ($250 5.6) + ($200 8). Three isocost curves for $1,000, $2,000, and $3,000 9