Download
1 / 47
470 likes | 570 Vues
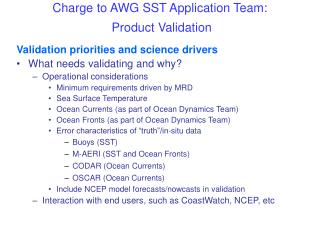
S-NPP VIIRS Cloud Mask Provisional Review 18 January 2013, NCWCP, College Park, MD. SST Team Feedback to VCM STAR - Sasha Ignatov, Prasanjit Dash, John Stroup, Yury Kihai, Boris Petrenko, Xingming Liang NAVOCEANO – Jean-Francois Cayula, Doug May. STAR Analyses.

E N D
S-NPP VIIRS Cloud Mask Provisional Review18 January 2013, NCWCP, College Park, MD SST Team Feedback to VCM STAR - Sasha Ignatov, Prasanjit Dash, John Stroup, Yury Kihai, Boris Petrenko, Xingming Liang NAVOCEANO – Jean-Francois Cayula, Doug May SST feedback to VCM
STAR Analyses • STAR analyses use VCM Confidently Clear data only (consistent with VCM Beta Review Analyses, Apr’2012) • SST QF have been analyzed & Discussed at several SST Telecons in Mar’2012 • Based on these analyses, SST QFs were found too restrictive and not used in SST Analyses • ACSPO (NOAA heritage) vs. IDPSSSTs • Objective: Ensure comparable SST performance in comparable SST domain • Analysis of one representative day of data • – 31 December 2012 in SST Quality Monitor (SQUAM) • www.star.nesdis.noaa.gov/sod/sst/squam/ SST feedback to VCM
NIGHT: ACSPO L2 minus OSTIA L4 31 December 2012 • Deviation from Reference SST is flat & close to 0 • Residual Cloud/Aerosol leakages seen as cold spots SST feedback to VCM
NIGHT: IDPS L2 minus OSTIA L4 31 December 2012 • More Cloud leakages in IDPS than in ACSPO • “Limb Cooling” – due to IDPS SST equations SST feedback to VCM
NIGHT: ACSPO L2 minus OSTIA L4 31 December 2012 • Shape close to Gaussian • Domain & Performance Stats close to expected SST feedback to VCM
NIGHT: IDPS L2 minus OSTIA L4 31 December 2012 • IDPS sample +28% larger compared to ACSPO • Shape less Gaussian (negative Skew / increased Kurt) • increased Min/Max, STDV/RSD & Larger fraction of outliers SST feedback to VCM
NIGHT: ACSPO L2 minus in situ SST 31 December 2012 • Shape close to Gaussian • Performance Stats better than specs SST feedback to VCM
NIGHT: IDPS L2 minus in situ SST 31 December 2012 • IDPS match-up data set +33% larger compared to ACSPO • Shape less Gaussian (increased Skew / Kurt) • increased Min/Max, STDV/RSD & Larger fraction of outliers SST feedback to VCM
NIGHT 31 December 2012 – Summary ΔT = “VIIRS minus OSTIA” SST (expected ~0) • IDPS SST domain is +28% larger but all Stats degraded, compared to ACSPO • Gap between Conventional and Robust stats wider in IDPS - More outliers ΔT = “VIIRS minus in situ” SST (expected ~0) • IDPS SST domain is +28% larger but all Stats degraded, compared to ACSPO • Gap between Conventional and Robust stats wider in IDPS - More outliers SST feedback to VCM
DAY: ACSPO L2 minus OSTIA L4 31 December 2012 • Deviation from Reference SST is flat & close to 0 • Residual Cloud/Aerosol leakages seen as cold spots SST feedback to VCM
DAY: IDPS L2 minus OSTIA L4 31 December 2012 • More Cloud leakages in IDPS than in ACSPO • “Limb Cooling” – due to SST equations/coefficients SST feedback to VCM
DAY: ACSPO L2 minus OSTIA L4 31 December 2012 • Shape close to Gaussian • Domain & Performance Stats close to expected SST feedback to VCM
DAY: IDPS L2 minus OSTIA L4 31 December 2012 • IDPS sample +25% larger compared to ACSPO • increased Min/Max, STDV/RSD & Larger fraction of outliers SST feedback to VCM
DAY: ACSPO L2 minus in situ SST 31 December 2012 • Shape close to Gaussian • Domain & Performance Stats close to expected SST feedback to VCM
DAY: IDPS L2 minus in situ SST 31 December 2012 • IDPS sample +51% larger compared to ACSPO • increased Min/Max, STDV/RSD & Larger fraction of outliers SST feedback to VCM
DAY 31 December 2012 – Summary ΔT = “VIIRS minus OSTIA” SST (expected ~0) • IDPS SST domain +25% larger but all Stats degraded, compared to ACSPO • Gap between Conventional and Robust stats wider in IDPS - More outliers ΔT = “VIIRS minus in situ” SST (expected ~0) • IDPS SST domain is +51% larger but all Stats degraded, compared to ACSPO • Gap between Conventional and Robust stats wider in IDPS - More outliers 18 January 2013 SST feedback to VCM SST feedback to VCM 16
STAR Conclusion and Work in Progress • VCM performance for SST remains suboptimal • IDPS domain larger than ACSPO, but SST statistics degraded • SST specs are not met (including revisited in new L1RD) • Part of SST performance is due to SST algorithms (e.g., limb cooling at swath edges) – work underway to revisit • Improvements are needed during both day and night • STAR work underway to improve VCM for SST • With U. Wisconsin Andy Heidinger and Denis Botambekov, to replicate SQUAM global analyses and fine-tune VCM, globally SST feedback to VCM
NAVOCEANO Analyses • NAVO analyzed VCM Mask and SST Quality Flags • Analyses stratified by Day and Night • NAVO also compared VCM with NAVO Cloud Mask (NCM) • SEATEMP (NAVO heritage) vs. IDPSSSTs • Objective: Ensure comparable SST performance in comparable SST domain • Analysis of 25 days of global data • from 10 Dec 2012 – 06 Jan 2013 SST feedback to VCM
Daytime EDR SST Statistics • 25 km / 4 hour match-up, 25 days, global coverage. • For comparison VIIRS Seatemp statistics SST feedback to VCM
Daytime EDR SST Statistics • Comparison graphics: High quality EDR SST - K10 SST feedback to VCM
Observations from Daytime Data • SST statistics wrt. in situ data (mean and STD) for the best quality data are remarkably similar between EDR and Seatemp • For the best quality data a standard deviation of about 0.45⁰C is acceptable. • However, the number of buoy match-ups which reflects the number of retrievals is low for best quality IDPS SSTs • Also, graphics of best quality EDR SST – K10 field show some potential problems • Best quality EDR SST is limited to a view zenith angle 40° (3 to 1 aggregation) compared with 53° VZA for Seatemp SST feedback to VCM
Nighttime EDR SST Statistics • 25 km / 4 hour match-up, 25 days, global coverage. • For comparison VIIRS Seatemp statistics. SST feedback to VCM
Nighttime EDR SST Statistics • Comparison graphics: High quality EDR SST - K10 SST feedback to VCM
Observations from Nighttime Data • Statistics for the best quality EDR data are similar to Seatemp • For the best quality data a RMS error of about 0.35⁰C is very good • However, the number of buoy match-ups which reflects the number of retrievals is low for best quality data • Graphics of EDR SST – K10 field show a few potential problems • Best quality EDR SST is limited to a satellite zenith angle 40° (3 to 1 aggregation) compared with 53° for Seatemp SST feedback to VCM
VIIRS Cloud Mask • For this evaluation, “VCM clear” means that VCM is “confidently clear” and all VCM tests were performed successfully, in other words, “confidently confidently clear.” • The purpose of VCM is to detect clouds. NCM is the NAVOCEANO Cloud mask. The purpose of NCM is to produce clean SST retrievals. • The evaluation is conducted on the “best” 200 daytime granules and the “best” 200 nighttime granules, where “best granules” are defined as the ones for which Seatemp produced the highest number of cloud-free SST retrievals • Underlying SST field is computed at full resolution with the expanded NL SST equations. • 25 km / 4 hour match-up, 25 days, partial coverage. SST feedback to VCM
IDPS Day SST - K10 (VCM=ConfidentlyConfidently Clear) • Daytime, VCM clear SST – K10 SST feedback to VCM
IDPS Night SST - K10 (VCM=Confidently Confidently Clear) • Nighttime, VCM clear SST – K10 SST feedback to VCM
VCM vs. NCM • Daytime statistics VCM / NCM • Nighttime statistics VCM / NCM SST feedback to VCM
NCM detects all sources of SST corruption. VCM “confidently clear” has more cloud leakages although next update may correct some problems. VCM confidence level flag must be used with the cloud mask quality flag to make decisions. The VCM flag defaults to clear. VCM quality level flag is always lower in sun glint regions even if the confidence flag is clear. Reducing the quality criteria to “medium” to obtain clear sun-glint pixels has a cost of obtaining other problems that contaminate SST. VCM vs. NCM Conclusions SST feedback to VCM
Best category EDR SST is of good quality with little cloud corruption. Best category EDR SST produces too few retrievals for our applications. Suggest at least removing satellite zenith angle, which is deterministic, as input to quality flag. NAVO EDR/VCM Summary SST feedback to VCM
STAR/NAVO Summary & Work in Progress • VCM performance for SST • VCM confidently clear domain larger than in ACSPO and SEATEMP, but SST statistics degraded and unacceptable • Using SST “highest quality” flags results in SST performance statistics comparable with ACSPO and SEATEMP, but in a much smaller domain • Work underway to improve VCM for SST • STAR to work with U. Wisconsin Andy Heidinger and Denis Botambekov to fine-tune VCM, globally • NAVO to work with AEROSPACE Tom Kopp, to identify problem cases / areas, and fix • SST Team to redefine SST Algorithms and Quality Flags (currently, both are suboptimal) SST feedback to VCM
Back Up Slides Another day of data – 25 September 2012 In SST Quality Monitor (SQUAM) www.star.nesdis.noaa.gov/sod/sst/squam/ SST feedback to VCM
Monitoring of ACSPOand IDPSSSTs in SST Quality Monitor (SQUAM) Analysis of one day of data – 25 September 2012 Presented at SST Telecon 10/03/12 www.star.nesdis.noaa.gov/sod/sst/squam/ SST feedback to VCM
NIGHT: ACSPO L2 minus Reynolds L4 25 September 2012 • Deviation from Reference SST is flat & close to 0 • Residual Cloud/Aerosol leakages seen as cold spots SST feedback to VCM
NIGHT: IDPS L2 minus Reynolds L4 25 September 2012 • More Cloud leakages in IDPS than in ACSPO • “Limb Cooling” – due to SST equations/coefficients SST feedback to VCM
NIGHT: ACSPO L2 minus Reynolds L4 25 September 2012 • Shape close to Gaussian • Domain & Performance Stats close to expected SST feedback to VCM
NIGHT: IDPS L2 minus Reynolds L4 25 September 2012 • IDPS sample +30% larger compared to ACSPO • Shape less Gaussian (negative Skew / increased Kurt) • Negative bias, increased Min/Max, STDV/RSD, fraction of outliers SST feedback to VCM
NIGHT: ACSPO L2 minus in situ SST 25 September 2012 • Shape close to Gaussian • Performance Stats better than specs SST feedback to VCM
NIGHT: IDPS L2 minus in situ SST 25 September 2012 • IDPS match-up data set +18% larger compared to ACSPO • Shape less Gaussian (increased Skew / Kurt) • increased Min/Max, STDV/RSD & Larger fraction of outliers SST feedback to VCM
NIGHT 25 September 2012 – Summary ΔT = “VIIRS minus Reynolds” SST (expected ~0) • IDPS SST domain +30% larger & Stats degraded, compared to ACSPO • Gap between Conventional and Robust stats wider in IDPS - More outliers ΔT = “VIIRS minus in situ” SST (expected ~0) • IDPS SST domain is +18% larger but all Stats degraded, compared to ACSPO • Gap between Conventional and Robust stats wider in IDPS - More outliers 18 January 2013 SST feedback to VCM SST feedback to VCM 40
DAY: ACSPO L2 minus Reynolds L4 25 September 2012 • Deviation from Reference SST is flat & close to 0 • Residual Cloud/Aerosol leakages seen as cold spots SST feedback to VCM
DAY: IDPS L2 minus Reynolds L4 25 September 2012 • More Cloud leakages in IDPS than in ACSPO • “Limb Cooling” – due to SST equations/coefficients SST feedback to VCM
DAY: ACSPO L2 minus Reynolds L4 25 September 2012 • Shape close to Gaussian • Domain & Performance Stats close to expected SST feedback to VCM
DAY: IDPS L2 minus Reynolds L4 25 September 2012 • IDPS sample +17% larger compared to ACSPO • Shape less Gaussian • Negative bias, increased Min/Max, Mean, STDV/RSD, % outliers SST feedback to VCM
DAY: ACSPO L2 minus in situ SST 25 September 2012 • Shape close to Gaussian • Domain & Performance Stats close to expected SST feedback to VCM
DAY: IDPS L2 minus in situ SST 25 September 2012 • IDPS sample +18% larger compared to ACSPO • Negative bias, increased Min/Max, STDV/RSD, % outliers SST feedback to VCM
DAY 25 September 2012 – Summary ΔT = “VIIRS minus Reynolds” SST (expected ~0) • IDPS SST domain +17% larger & Stats degraded, compared to ACSPO • Gap between Conventional and Robust stats wider in IDPS - More outliers SST feedback to VCM