Download
1 / 10
100 likes | 199 Vues
B. 8 / 10 / 13. A. D. E. 4 / 5 / 6. 7 / 8 / 9. 5 / 6 / 8. C. 9 / 12 / 16. ACTIVITY. a. m. b. A. 4. 5. 6. B. 8. 10. 13. C. 9. 12. 16. D. 7. 8. 9. E. 5. 6. 8. We have a network with activities A, B, C, D and E, which are organized as shown at left.

E N D
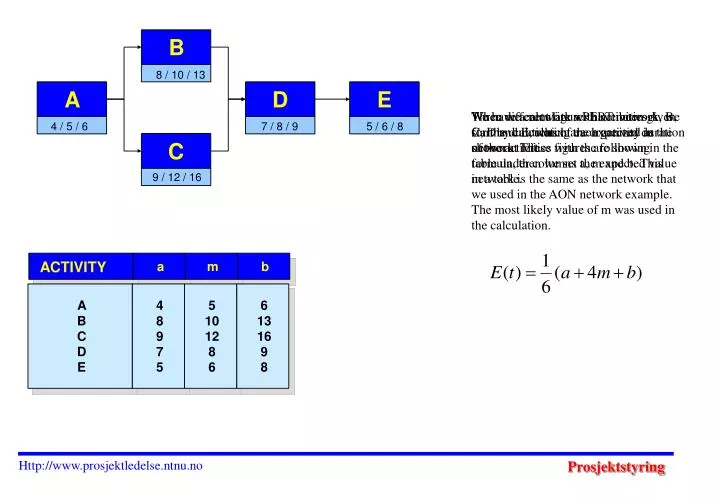
B 8 / 10 / 13 A D E 4 / 5 / 6 7 / 8 / 9 5 / 6 / 8 C 9 / 12 / 16 ACTIVITY a m b A 4 5 6 B 8 10 13 C 9 12 16 D 7 8 9 E 5 6 8 We have a network with activities A, B, C, D and E, which are organized as shown at left. When we calculate a PERT network, we start by calculating the expected duration of the activities with the following formula, then we set the expected value in a table. Three different figures have been given for the durations of each activity in the network. These figures are shown in the table under columns a, m and b. This network is the same as the network that we used in the AON network example. The most likely value of m was used in the calculation. Http://www.prosjektledelse.ntnu.no
B 8 / 10 / 13 A D E 4 / 5 / 6 7 / 8 / 9 5 / 6 / 8 C 9 / 12 / 16 ACTIVITY a m b E(t) A 4 5 6 5.0 B 8 10 13 10.2 C 9 12 16 12.2 D 7 8 9 8.0 E 5 6 8 6.2 Accordingly, this is carried out for activities C, D and E, and the results are set into the table. The expected duration of B becomes: The expected duration of activity A becomes: Http://www.prosjektledelse.ntnu.no
B 8 / 10 / 13 A D E 4 / 5 / 6 7 / 8 / 9 5 / 6 / 8 C 9 / 12 / 16 ACTIVITY a m b E(t) Var(t) A 4 5 6 5.0 0.11 B 8 10 13 10.2 0.69 C 9 12 16 12.2 1.36 D 7 8 9 8.0 0.11 E 5 6 8 6.2 0.25 Accordingly, this is calculated for activities B, C, D and E, and the results are set into the table. The variance of activity A becomes: To find the variance of the activities, we use this formula: Http://www.prosjektledelse.ntnu.no
5.0 15.2 B 2 (10.2) 0 17.2 25.2 25.2 31.4 5.0 7.0 17.2 A D E 0 0 0 (5.0) (8.0) (6.2) 5.0 17.2 0 17.2 25.2 5.0 25.2 31.4 C 0 (12.2) 5.0 17.2 ACTIVITY a m b E(t) Var(t) A 4 5 6 5.0 0.11 B 8 10 13 10.2 0.69 C 9 12 16 12.2 1.36 D 7 8 9 8.0 0.11 E 5 6 8 6.2 0.25 PERT gives us a more realistic estimate. The reason that we get a little longer value when we use PERT is that we take into consideration the risk that results when several of the activities have imbalanced distributions. Activities A and D are distributed asymetrically. This means that there is an equal probability that they will become shorter or longer (delayed). In other words, the expected values for A and D are equal to the most likely value of m. The calculation of the network is carried out with the same method as was used in the AON example, but in this case, expected values are used in the calculations. Therefore, expected values have been set as the durations of the activities in the network. By using the CPM method in the AON network, the total time of the project was calculated at 31 weeks. When we use the PERT method, it becomes 31,4 weeks. An imbalanced distribution to the right side means that it is more likely that the duration of the project will become longer rather than shorter. This applies to activities B, C and D. Therefore, the expected value becomes a little larger than the most likely value of m. Http://www.prosjektledelse.ntnu.no
5.0 15.2 B 2 (10.2) 0 17.2 25.2 25.2 31.4 5.0 7.0 17.2 A D E 0 0 0 (5.0) (8.0) (6.2) 5.0 17.2 0 17.2 25.2 5.0 25.2 31.4 C 0 (12.2) 5.0 17.2 ACTIVITY a m b E(t) Var(t) A 4 5 6 5.0 0.11 B 8 10 13 10.2 0.69 C 9 12 16 12.2 1.36 D 7 8 9 8.0 0.11 E 5 6 8 6.2 0.25 We can also calculate the variance of project by adding along the critical path. For this purpose, we use the values in the table. We calculated the total time of project by adding the durations of the activities along the critical path, which is A-C-D-E. Now we can use values from the network or the table. Var(Tp) = Var(tA) + Var(tC) + Var(tD) + Var(tE) = 0.11 + 1.36 + 0.11 + 0.25 = 1.83 E(Tp) = E(tA) + E(tC) + E(tD) + E(tE) = 5.0 +12.2 + 8.0 + 6.2 = 31.4 Tp = tA+ tC+ tD+ tE Http://www.prosjektledelse.ntnu.no
5.0 15.2 B 2 (10.2) 0 17.2 25.2 25.2 31.4 5.0 7.0 17.2 A D E 0 0 0 (5.0) (8.0) (6.2) 5.0 17.2 0 17.2 25.2 5.0 25.2 31.4 C 0 (12.2) 5.0 17.2 ACTIVITY a m b E(t) Var(t) A 4 5 6 5.0 0.11 B 8 10 13 10.2 0.69 C 9 12 16 12.2 1.36 D 7 8 9 8.0 0.11 E 5 6 8 6.2 0.25 What is the probability that the project is accomplished in 28 weeks? We will use the normalized normal distribution. To normalize, we subtracrt 28 from the expected value of 31,4 and divide the result by the standard deviation. The standard deviation is the square root of the variance. This means that the project has an expected duration of 31,4, and the duration has a normal distribution with a variance of 1,83. We will now find the probability that the total duration along the critical path becomes less than or equal to 28 weeks. Http://www.prosjektledelse.ntnu.no
z ,00 ,01 ,02 ,03 ,04 ,05 0,6 ,07 ,08 ,09 0,0 ,500 ,504 ,508 ,512 ,516 ,520 ,524 ,528 ,532 ,536 0,1 ,540 ,544 ,548 ,552 ,556 ,560 ,564 ,567 ,571 ,575 0,2 ,579 ,583 ,587 ,591 ,595 ,599 ,603 ,606 ,610 ,614 0,3 ,618 ,622 ,626 ,629 ,633 ,637 ,641 ,644 .548 ,652 0,4 ,655 ,659 ,663 ,666 ,670 ,674 ,677 ,681 ,684 ,688 0,5 ,691 ,695 ,698 ,702 ,705 ,709 ,712 ,716 ,719 ,722 0,6 ,726 ,729 ,732 ,736 ,739 ,742 ,745 ,749 ,752 ,755 0,7 ,758 ,761 ,764 ,767 ,770 ,773 ,776 ,779 ,782 ,785 0,8 ,788 ,791 ,794 ,797 ,800 ,802 ,805 ,808 ,811 ,813 0,9 ,816 ,819 ,821 ,824 ,826 ,829 ,831 ,834 ,836 ,839 1,0 ,841 ,844 ,846 ,849 ,851 ,853 ,855 ,858 ,860 ,862 1,1 ,864 ,867 ,869 ,871 ,873 ,875 ,877 ,879 ,881 ,883 1,2 ,885 ,887 ,889 ,891 ,893 ,894 ,896 ,898 ,900 ,901 ,903 ,905 ,907 ,908 ,910 ,911 ,913 ,915 ,916 ,918 1,3 1,4 ,919 ,921 ,922 ,924 ,925 ,926 ,928 ,929 ,931 ,932 1,5 ,933 ,934 ,936 ,937 ,938 ,939 ,941 ,942 ,943 ,944 1,6 ,945 ,946 ,947 ,947 ,948 ,949 ,951 ,952 ,953 ,954 1,7 ,955 ,956 ,957 ,958 ,959 ,960 ,961 ,962 ,962 ,963 1,8 ,964 ,965 ,966 ,966 ,967 ,968 ,969 ,969 ,970 ,971 1,9 ,971 ,972 ,973 ,973 ,974 ,974 ,975 ,976 ,976 ,977 2,0 ,977 ,978 ,978 ,979 ,979 ,980 ,980 ,981 ,981 ,982 2,1 ,982 ,983 ,983 ,983 ,984 ,984 ,985 ,985 ,985 ,986 2,2 ,986 ,986 ,987 ,987 ,987 ,988 ,988 ,988 ,989 ,989 2,3 ,989 ,990 ,990 ,990 ,990 ,991 ,991 ,991 ,991 ,992 2,4 ,992 ,992 ,992 ,992 ,993 ,993 ,993 ,993 ,993 ,994 2,5 ,994 ,994 ,994 ,994 ,994 ,995 ,995 ,955 ,995 ,995 2,6 ,995 ,995 ,996 ,996 ,996 ,996 ,996 ,996 ,996 ,996 2,7 ,997 ,997 ,997 ,997 ,997 ,997 ,997 ,997 ,997 ,997 2,8 ,997 ,998 ,998 ,998 ,998 ,998 ,998 ,998 ,998 ,998 2,9 ,998 ,998 ,998 ,998 ,998 ,998 ,998 ,999 ,999 ,999 3,0 ,999 ,999 ,999 ,999 ,999 ,999 ,999 ,999 ,999 ,999 Since the normal distribution table is asymmetric, we can read it from the positive value of 2.51. However, since we can not get the number directly from the table, we get the probability that the project has a duration that is over 28 weeks. Therefore, we set up this equation: So the probability that the project is accomplished in 28 weeks or less is 0,6% By following 2,51 in the table, we read 0,994, which gives us: Now we should look at the normal distribution table for our value. Http://www.prosjektledelse.ntnu.no
5.0 15.2 B 2 (10.2) 0 17.2 25.2 25.2 31.4 5.0 7.0 17.2 A D E 0 0 0 (5.0) (8.0) (6.2) 5.0 17.2 0 17.2 25.2 5.0 25.2 31.4 C 0 (12.2) 5.0 17.2 ACTIVITY a m b E(t) Var(t) A 4 5 6 5.0 0.11 B 8 10 13 10.2 0.69 C 9 12 16 12.2 1.36 D 7 8 9 8.0 0.11 E 5 6 8 6.2 0.25 Now we must find which duration should be given in order to have 90% confidence in avoiding time overrun. This becomes: We will now find the probability that T is less than or equal to value x, which is 90%. Http://www.prosjektledelse.ntnu.no
z ,00 ,01 ,02 ,03 ,04 ,05 0,6 ,07 ,08 ,09 0,0 ,500 ,504 ,508 ,512 ,516 ,520 ,524 ,528 ,532 ,536 0,1 ,540 ,544 ,548 ,552 ,556 ,560 ,564 ,567 ,571 ,575 0,2 ,579 ,583 ,587 ,591 ,595 ,599 ,603 ,606 ,610 ,614 0,3 ,618 ,622 ,626 ,629 ,633 ,637 ,641 ,644 .548 ,652 0,4 ,655 ,659 ,663 ,666 ,670 ,674 ,677 ,681 ,684 ,688 0,5 ,691 ,695 ,698 ,702 ,705 ,709 ,712 ,716 ,719 ,722 0,6 ,726 ,729 ,732 ,736 ,739 ,742 ,745 ,749 ,752 ,755 0,7 ,758 ,761 ,764 ,767 ,770 ,773 ,776 ,779 ,782 ,785 0,8 ,788 ,791 ,794 ,797 ,800 ,802 ,805 ,808 ,811 ,813 0,9 ,816 ,819 ,821 ,824 ,826 ,829 ,831 ,834 ,836 ,839 1,0 ,841 ,844 ,846 ,849 ,851 ,853 ,855 ,858 ,860 ,862 1,1 ,864 ,867 ,869 ,871 ,873 ,875 ,877 ,879 ,881 ,883 1,2 ,885 ,887 ,889 ,891 ,893 ,894 ,896 ,898 ,900 ,901 ,903 ,905 ,907 ,908 ,910 ,911 ,913 ,915 ,916 ,918 1,3 1,4 ,919 ,921 ,922 ,924 ,925 ,926 ,928 ,929 ,931 ,932 1,5 ,933 ,934 ,936 ,937 ,938 ,939 ,941 ,942 ,943 ,944 1,6 ,945 ,946 ,947 ,947 ,948 ,949 ,951 ,952 ,953 ,954 1,7 ,955 ,956 ,957 ,958 ,959 ,960 ,961 ,962 ,962 ,963 1,8 ,964 ,965 ,966 ,966 ,967 ,968 ,969 ,969 ,970 ,971 1,9 ,971 ,972 ,973 ,973 ,974 ,974 ,975 ,976 ,976 ,977 2,0 ,977 ,978 ,978 ,979 ,979 ,980 ,980 ,981 ,981 ,982 2,1 ,982 ,983 ,983 ,983 ,984 ,984 ,985 ,985 ,985 ,986 2,2 ,986 ,986 ,987 ,987 ,987 ,988 ,988 ,988 ,989 ,989 2,3 ,989 ,990 ,990 ,990 ,990 ,991 ,991 ,991 ,991 ,992 2,4 ,992 ,992 ,992 ,992 ,993 ,993 ,993 ,993 ,993 ,994 2,5 ,994 ,994 ,994 ,994 ,994 ,995 ,995 ,955 ,995 ,995 2,6 ,995 ,995 ,996 ,996 ,996 ,996 ,996 ,996 ,996 ,996 2,7 ,997 ,997 ,997 ,997 ,997 ,997 ,997 ,997 ,997 ,997 2,8 ,997 ,998 ,998 ,998 ,998 ,998 ,998 ,998 ,998 ,998 2,9 ,998 ,998 ,998 ,998 ,998 ,998 ,998 ,999 ,999 ,999 3,0 ,999 ,999 ,999 ,999 ,999 ,999 ,999 ,999 ,999 ,999 We can now read from the table that 0,90 corresponds to (1,28). So we have: Http://www.prosjektledelse.ntnu.no
5.0 15.2 B 2 (10.2) 0 17.2 25.2 25.2 31.4 5.0 7.0 17.2 A D E 0 0 0 (5.0) (8.0) (6.2) 5.0 17.2 0 17.2 25.2 5.0 25.2 31.4 C 0 (12.2) 5.0 17.2 ACTIVITY a m b E(t) Var(t) A 4 5 6 5.0 0.11 B 8 10 13 10.2 0.69 C 9 12 16 12.2 1.36 D 7 8 9 8.0 0.11 E 5 6 8 6.2 0.25 In order to be 90% sure that the project will not have time overrun, we should plan a duration of 33,1 weeks for the project. Http://www.prosjektledelse.ntnu.no