Download
1 / 55
550 likes | 555 Vues
Scientific Method, Lab Report Format and Graphing. Observation. Perceive objects/events using senses Scientists identify problem to solve by observing world around them. Ask Questions. Results from observations, insights, ideas

E N D
Observation Perceive objects/events using senses Scientists identify problem to solve by observing world around them
Ask Questions Results from observations, insights, ideas Information collected from research, observations in attempt to answer questions
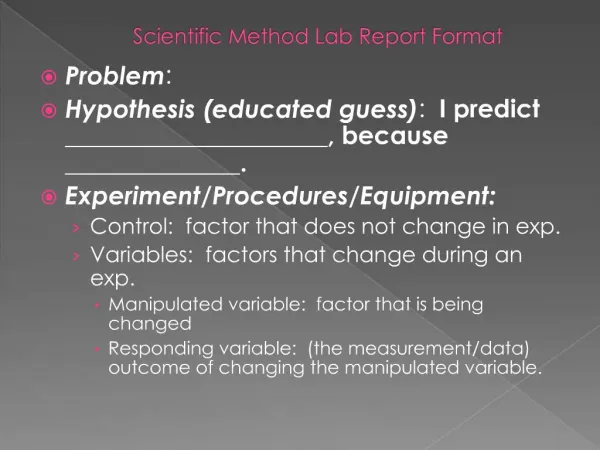
Forming Hypothesis and Making Predictions • Hypothesis - statement that can be tested by observations or experimentation • It is a tentative explanation for problem/question, educated guess • Prediction - expected outcome of test • Based on hypothesis
Setting up a controlled experiment • Use controlled experiment to test hypothesis • Experiments are planned procedures to test hypotheses
Record and Analyze Results • Record data • Put data into graphs • Analyze data
Draw Conclusions • Use data to evaluate hypothesis • Does evidence from experiment support or refute (reject) hypothesis
Publish Results • Allows others to use information, repeat experiments to confirm validity of results, review experimental design
Repeating Investigations • Experimental results should be able to be reproduced because nature behaves in a consistent manner
Theory • Set of related hypotheses that have been tested and confirmed many times by scientists • Generally accepted as true
Controlled Experiments • Involve a Control group and an Experimental group • Experimental group - group that receives the experimental treatment, all other conditions kept the same except for the single condition being tested which is called the independent variable
Controlled Experiments • Involve a Control group and an Experimental group • Control group - all conditions kept the same, receives no experimental treatment, is the experimental trial without the independent variable, used to compare experimental group to, helps determine if changes are caused by independent variable, or some other factor
Variables Independent or manipulated variable - factor that is varied or tested in an experiment, what we want to test, condition being changed Dependent or responding variable - variable that is measured in an experiment, what happens because of the independent variable Controlled Variables (controls) - other factors that could cause changes in the dependent variable, so the scientist wants to keep them the same or constant, so they don’t cause changes
Controlled Experiments • Experiment should be repeated (replicates) or use a large sample size to verify results • Be sure to test only one factor (independent variable) at a time • Test independent variable at different values if possible • Try to eliminate or control all other factors
Introduction to Hypothesis Testing A hypothesis is a statement explaining that a causal relationship exists between an underlying factor (variable) and an observable phenomenon Often after making an observation, you might propose some sort of tentative explanation for the phenomenon; this could be called your working hypothesis.
Because absolute proof is not possible, statistical hypothesis testing focuses on trying to reject a null hypothesis. A null hypothesis is a statement explaining that the underlying factor or variable is independent of the observed phenomenon—there is no causal relationship. For example, an appropriate null hypothesis might be that the light does not affect plant growth, that there will be no difference between the experimental and control group.
The alternative to the null hypothesis might be that there is a difference between the two groups (control-no light and experimental-light). Usually (but not always), an investigator is trying to find an alternative to the null hypothesis—evidence that supports the alternative hypothesis by rejecting the null (based on statistical tests).
Examples of the Null Hypothesis A researcher may postulate a hypothesis: H1: Tomato plants exhibit a higher rate of growth when planted in compost rather than in soil. And a null hypothesis: H0: Tomato plants do not exhibit a higher rate of growth when planted in compost rather than soil. It is important to carefully select the wording of the null, and ensure that it is as specific as possible. For example, the researcher might postulate a null hypothesis: H0: Tomato plants show no difference in growth rates when planted in compost rather than soil. There is a major flaw with this H0. If the plants actually grow more slowly in compost than in soil, an impasse is reached. H1is not supported, but neither is H0, because there is a difference in growth rates.
It is important to realize that hypothesis testing does not allow proof, or even acceptance, of the alternative to the null hypothesis. Typically, the decision comes down to whether there is enough evidence to reject the null hypothesis. If evidence to reject the null hypothesis is sufficient, what can be said is that the investigator rejects the null hypothesis—not that the investigation has proven the alternative hypothesis.
Before experiment • Purpose: What is the purpose of the experiment? Why are we doing the experiment? Background information, research needed to help understand or design experiment, reason leading to hypothesis (theory) • Materials: Detailed list of materials, equipment needed
III. Procedure: Detailed step by step instructions of exactly what you plan to do. (Can someone else use your instructions to repeat experiment) • Include diagram of experimental setup • Specifically discuss variables • Independent – how it will be manipulated, differing levels/amounts/concentrations to be administered • Dependent – how it will be measured-tool or instrument to be used, units, frequency of measurements, if not a common method of collecting data, a picture or diagram illustrating how data is to be collected • Controlled variables specifically how they will be regulated/controlled if not already done • Safety precautions/equipment required • Clearly state how data will be collected
IV. Data tables: Blank table to record data. Prepare before experiment. Think about what you will measure, how you will measure it, how long you will measure it, how frequently will you take measurements, and what instruments you will use to make the measurements? Units for data, uncertainties of data (15-20 measurements)
During experiment Collect and record raw data (what you measured) accurately and neatly into organized data tables Include qualitative observations if appropriate/necessary
Data Collection and Processing - uncertainties • For most measuring devices, uncertainty is half the place value of the last measured value; ex. 25.5 ºC (± 0.5 ºC) • Rulers have an uncertainty of ±1 of the smallest division; ex. 3.1cm ( ± 0.1cm) • For electronic instruments the value is ±1 unit of the last decimal place; ex. 13.7 g (± 0.1g)
Data Processing • Show and perform necessary calculations (calculate means, standard deviations, rates, standardize measurements (divide by volume or surface area to make equivalent) • Include units, significant figures • Presenting data-graph data to show trends or relationships, to compare data
After experiment • Graphs and Charts: graph data or place in charts to give visual representation of data. This will help to analyze data. Choose correct type of graph to show data, does graph show data the way that you want it to?
Conclusion: Summarize results of experiment (what happened?). Analyze results (why it happened?) • Analyze data and draw conclusions from results based on reasonable interpretation of data, referring to data when possible • Explain/justify experimental results • Evaluate hypothesis: accept/modify/reject?
Evaluating Procedures and Results • Evaluate weaknesses and limitations of design of investigation and performance of your procedure • Focus on systematic errors • Is data reliable, or did these weaknesses and limitations impact your data • Small sample size, important variables not controlled, data not recorded accurately/reliably • Identify and discuss significant errors, and how they affected results
Suggesting improvements • Suggest realistic improvements to identified weaknesses and limitations and should focus on specific pieces of equipment or techniques used
Error Analysis • Human error • measurements taken inaccurately, inconsistently • Systematic errors • Affects data the same amount every time (equipment not calibrated, zeroed, worn, procedures incorrect, unreliable) • Sources usually identifiable, may be eliminated or reduced by changes to the experiment • Random error • Does not affect every measurement taken or affect them in the same manner (reading of apparatus) • The more trails done, the less of an effect a random error may have on results • May result from limits of accuracy of the apparatus, inconsistent recording, natural variations in samples
GRAPHING • Title Graph - short but good descriptive title that clearly tells what the graph is about. • Identify the Variables • independent variable goes on X axis (horizontal) or TIME when the effect of the independent variable is measured over time (variable vs. control or different degrees of variable will be shown as different lines on graph • Dependent variable goes on Y axis (vertical)
Determine the Scale of the Graph - determine scale (numerical value for each square) to best fit the range of each variable. Spread the graph to use the MOST of the available space. • Number and Label Each Axis - tells what data the lines on graph represent. Include units. Number/index marks should be equivalent to intervals between experimental data collected.
Plot the Points - plot each data value on graph with dot • Draw the Graph - connect dots with lines on continuous data. Show approximate best fit line/curve if appropriate (most graphs of experimental data are not drawn as “connect the dots” • Label Lines or Use Legend - if graph shows more then one line/set of data, label line or make a legend/key. Use different marks/colors for different sets of data
Types of Graphs • Pie Charts - used to compare parts of a whole (% of something). Use legend to describe what each slice represents • Line Graphs - Used for continuous data-data that is changing. Used to track changes over time or to measure the effect of one thing on another • Bar Graph - used to compare something between groups. Can be used to show large changes over time. Use legend to tell what each bar represents
X-Y plot (Scatterplot) - used to determine if there is a relationships between things. Used when data points are not related/do not show changes over time/effects
Histogram When an investigation involves measurement data, one of the first steps is to construct a histogram to represent the data’s distribution to see if it approximates a normal distribution. Creating this kind of graph requires setting up bins—uniform range intervals that cover the entire range of the data. Then the number of measurements that fit in each bin (range of units) are counted and graphed on a frequency diagram, or histogram. If enough measurements are made, the data can show an approximate normal distribution, or bell-shaped distribution, on a histogram. These constitute parametric data. The normal distribution is very common in biology and is a basis for the predictive power of statistical analysis.
Bar Graph • Pie Chart
Examples of Line Graphs • Can use broken graph where large gaps in data occur
Connect points with line • Show key/use different colors, marks for different sets of data
A normal distribution is a very important statistical data distribution pattern occurring in many natural phenomena, such as height, blood pressure, lengths of objects produced by machines, etc. Certain data, when graphed (data on the horizontal axis, amount of data on the vertical axis), creates a bell-shaped curve known as a normal curve, or normal distribution.