Download
1 / 1
10 likes | 91 Vues
Ubiquitous Monitoring of Boredom. H. Estépar 2 , D. Shastri 1 , A. Mandapati 1 , I. Pavlidis 1. (1) Department of Computer Science, University of Houston, Houston, TX 77204. dshastri , amandapa , ipavlidis@uh.edu,.

E N D
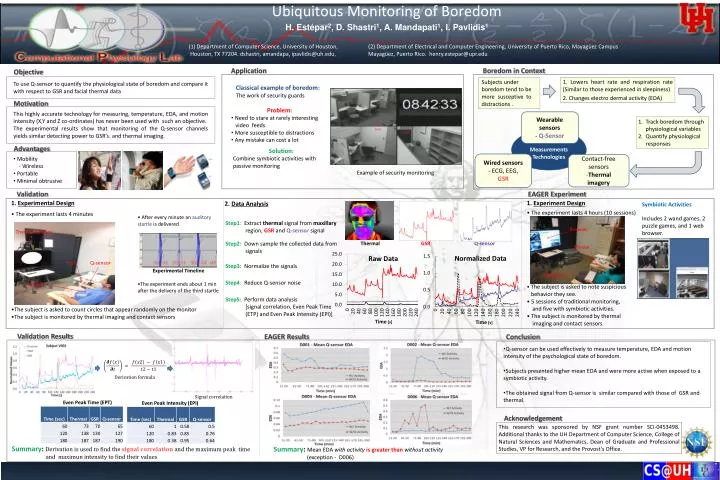
Ubiquitous Monitoring of Boredom H. Estépar2, D. Shastri1, A. Mandapati1, I. Pavlidis1 (1) Department of Computer Science, University of Houston, Houston, TX 77204. dshastri, amandapa, ipavlidis@uh.edu, (2) Department of Electrical and Computer Engineering, University of Puerto Rico, Mayagüez Campus Mayagüez, Puerto Rico. henry.estepar@upr.edu Application Boredom in Context Objective • To use Q-sensor to quantify the physiological state of boredom and compare it withrespect to GSR and facial thermal data • 1. Lowers heart rate and respiration rate (Similar to those experienced in sleepiness) • 2. Changes electro dermal activity (EDA) Subjects under boredom tend to be more susceptive to distractions . Classical example of boredom: The work of security guards Motivation • Problem: • Need to stare at rarely interesting • video feeds • More susceptible to distractions • Any mistake can cost a lot This highly accurate technology for measuring, temperature, EDA, and motion intensity (X,Y and Z co-ordinates) has never been used with such an objective. The experimental results show that monitoring of the Q-sensor channels yields similar detecting power to GSR’s. and thermal imaging. Wearable sensors - Q-Sensor Track boredom through physiological variables Quantify physiological responses Measurements Technologies Advantages Solution: Combine symbiotic activities with passive monitoring • Mobility • - Wireless • Portable • Minimal obtrusive Wired sensors - ECG, EEG, GSR Contact-free sensors -Thermal imagery Example of security monitoring Validation EAGER Experiment 1. Experimental Design 1. Experiment Design 2. Data Analysis Symbiotic Activities Includes 2 wand games, 2 puzzle games, and 1 web browser. • The experiment lasts 4 hours (10 sessions) • The subject is asked to note suspicious • behavior they see. • 5 sessions of traditional monitoring, • and five with symbiotic activities. • The subject is monitored by thermal • imaging and contact sensors • The experiment lasts 4 minutes • The subject is asked to count circles that appear randomly on the monitor • The subject is monitored by thermal imaging and contact sensors • After every minute an auditory startle is delivered • Experimental Timeline • The experiment ends about 1 min after the delivery of the third startle Step1: Extract thermalsignal from maxillaryregion, GSRand Q-sensorsignal Step2: Down sample the collected data from signals Step3:Normalize the signals Step4: Reduce Q-sensor noise Step5: Perform data analysis [signal correlation, Even Peak Time (ETP) and Even Peak Intensity (EPI)] Browser Thermal camera Thermal GSR Q-sensor Mouse Q-sensor GSR Keyboard Subject Time [s] Time [s] Validation Results EAGER Results Conclusion • Q-sensor can be used effectively to measure temperature, EDA and motion intensity of the psychological state of boredom. • Subjects presented higher mean EDA and were more active when exposed to a symbiotic activity. • The obtained signal from Q-sensor is similar compared with those of GSR and thermal. Even Peak Time (EPT) Even Peak Intensity (EPI) Acknowledgement This research was sponsored by NSF grant number SCI-0453498. Additional thanks to the UH Department of Computer Science, College of Natural Sciences and Mathematics, Dean of Graduate and Professional Studies, VP for Research, and the Provost’s Office. Summary: Summary: Mean EDA with activityis greater than without activity (exception - D006)