Download
1 / 68
710 likes | 899 Vues
Advancements in Photovoltaics. Claudia Pavel September 14, 2010. Objectives. Explaining how a grid-tied solar electric system works Understanding solar terminology Power vs Energy STC vs PTC Technology Update PV Industry Review. Grid-tied Solar System Components. Solar Modules

E N D
Advancements in Photovoltaics Claudia Pavel September 14, 2010
Objectives • Explaining how a grid-tied solar electric system works • Understanding solar terminology • Power vs Energy • STC vs PTC • Technology Update • PV Industry Review
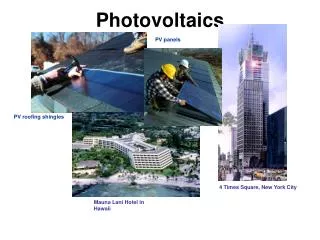
Grid-tied Solar System Components Solar Modules Inverter Electric Service Panel Meters Utility Grid Locale / site Installation
Explaining How a Solar Electric System Works • “Net metering” is the most difficult concept of a grid-tied system • Batteryless systems shut down when the grid goes down • Solar REC meter only applies to PNM territory, but….
Explaining How a Solar System Works Solar Power (DC) Inverter (DC to AC) House Service Panel (AC) House AC Loads Meter Utility Grid
Grid Tied PV - Block Diagram Solar Power (DC) Inverter (DC to AC) Batteries (DC) - Optional - House Service Panel (AC) Critical (Backed Up) AC Loads House AC Loads Meter Utility Grid
Understanding Terminology Small Scale Wind Generators (Electricity) Solar Electricity, Photovoltaics Solar Thermal - Hot water & Heating Solar Air Collector - Heat
Understanding Terminology Solar Electric Systems • Stand Alone (Off-Grid) • Batteryless Grid-Tied (Utility-Intertied) • Grid-Tied with Battery Back-Up
Understanding Terminology • Power is the Rate of Energy The unit of power is watts The power of a 100 watt light bulb is 100 watts • Energy is work The unit of energy is watts x time or watt-hours One 100 watt light bulb “on” for 10 hours = 1000 watt-hours 1 kilowatt (kWh).
Converting Module STC to Output • Output = Sun-hours x derating x PV kW (DC) • Sun-hours = 6.4 hours/day in Albuquerque • Derating ~ 62% to 82% 1: • Temperature 83% to 92% • Module soiling, mismatch, etc 85% to 93% • Inverter efficiency 88% to 96% • Example of standard 3kW project: • 6.4 sun-hrs x 66% derating x 3.0 kW = 12.7 kWh/day • 12.7kWh/day x 30 days = 381 kWh per month • This covers 64% of average energy per household 1. This excludes derating for shading, tilt angle, and orientation
Longevity of Equipment • Solar Panels (PV modules) • Warranted to produce > 80% of rated power for 25 years • Rated to withstand 1 inch hailstone • Inverter • Warranted for 10 years • Expected life about 15-20 years • Represents ~10% of total system cost
Modules are Not Created EqualModule Specifications Sharp NT-175U1 Module Specification: Maximum Power (STC) 175 Watts PTC Power Rating 151.8 Watts Open Circuit Voltage 44.4Voc Maximum Voltage 35.4 Vmp Short Circuit Current 5.4 Isc Maximum Current 4.95 Imp Temperature Coefficient of Voltage -0.144V/ deg. C
Module Rating - PTC vs STC • STC (Standard Test Conditions) is the standard used to sell the module: • Assumptions: 1000/W per m2, 25 degree module cell temperature (laboratory conditions) • PTC stands for PVUSA Test Condition and more closely states module rating • Assumptions: 800/W per m2, 20 degree C ambient temperature, and 1 m/s wind speed. • PTC averages about 89% of STC but makes modules easier to compare http://www.gosolarcalifornia.org/equipment/pvmodule.html
Sqft Manufacturer's 60 SunPower, Sanyo . 80 Sharp, Suntech, Solarworld 94 Evergreen, Kyocera 108 Nano-solar 156 First Solar 183 Uni-solar, Kaneka Module Efficiency
A VISION for PV • European PV Industry Association estimates PV to offset 12% of total power by 2020. • PV growth rate to reach this goal is 25%/yr or 250 Gigawatts (GW) worldwide in 10 years. • What technology takes us to 250 GW of PV?
First Solar Close to Grid ParityWall Street’s Glamour Company
Indium used in most thin film technologies has 13 years left at present consumption levels
Electric Vehicles (EV) are Coming * Before incentives
SunPower Flat Tile & S Tile BIPV S-Tile Flat Tile
Global power needs Energy prices / Energy security Climate change Solar price parity Roughly double by 2025 – US DOE Oil $50-$110 per barrel – Goldman Sachs Need 30% renewables by 2030 – NREL 5-10 years for major markets - Sunpower What’s Driving the Solar Market?
Growth rate = 30% per year over 15 years Total installed = 20 GW Germany = 9 GW / Spain = 2.8% of usage Source: Photon International, Feb 2010
All market segments expected to more than double for the next several years Local and national policy will impact these projections
3 to 1 leverage Source: https://eed.llnl.gov/flow/02flow.php
Today’s Electricity Energy Sources US 1 PNM 2 Coal 52% 41% Nuclear 21% 16% Oil/Gas 18% 22% RE 10% 8% Purchases 13% Source: (1) US – DOE data 2006 (2) PNM - 2008
What is Driving the Solar Market?Climate Change 10/20/30 Plan 20% by 2020 / 30% by 2030 Target: stabilize climate change at 550 parts per million
Plan B Target: stabilize climate change at 350 parts per million
First Energy Efficiency and Conservation “Efficiency can save 75 percent of America’s electricity at lower cost than making it at existing power plants.” -- Amory Lovins, 2006 Rocky Mountain Institute
www.dsireusa.orgDatabase for State Incentives for Renewables & Efficiency Additional Summary Maps 3rd-Party Solar PPA Policies Grant Programs for Renewables Interconnection Standards Loan Programs for Renewables Net Metering Policies PACE Financing Policies Property Tax Incentives for Renewables Public Benefits Funds for Renewables Rebate Programs for Renewables RPS Policies with Solar/DG Provisions Sales Tax Incentives for Renewables
Market penetration expected to be ~2-3 years ahead of this projection 2010 Market Forecast