Download
1 / 24
250 likes | 444 Vues
Molecular Graphics. Molecular Graphics What?. PDF 00-057-0248 ULM-8 A microporous florinated gallium phosphate with N 4 C 6 H 19 in the pores. PDF-4 products contain data sets with atomic coordinates.

E N D
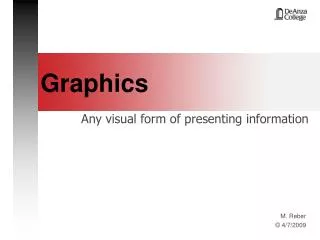
Molecular GraphicsWhat? PDF 00-057-0248 ULM-8 A microporous florinated gallium phosphate with N4C6H19 in the pores PDF-4 products contain data sets with atomic coordinates. A molecular graphic package embedded in the product allows the molecules to be displayed (above). Data can also be exported for use in other graphics utility programs.
Molecular GraphicsWhy? Through the use of molecular graphics, molecules can be visualized and examined for their conformation. This is important in understanding how materials react and interact. The particular molecular graphics package employed in PDF-4 was originally developed by a team at Crystal Impact, as part of the Linus Pauling Project, headed by Dr. Pierre Villars, President of MPDS. This package also examines the “atomic environment” around each atom as a means of studying molecular “building blocks” and determining structural prototypes.
Unit Cell Cryolite Na3AlF6 Atomic Environments (AE) Na (1) Al Na (2) PDF 04-007-8587
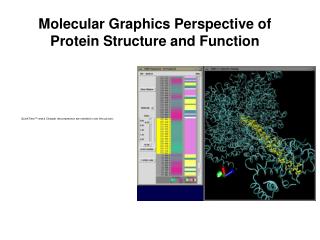
Molecular GraphicsHow? PDF 04-007-8587, Cryolite Site Occupancy Factor (SOF) Temperature Factors ITF = Isotropic (shown) Table provided for anisotropic factors Symmetry Operators Atomic Coordinates Symmetry Wyckoff Notation Atom Designations Molecular graphics are calculated from the atomic parameters and symmetry operators shown in the Structure tab of a PDF Card. The unit cell parameters in the Crystal tab are also used.
Getting Started To display molecules and atomic environments, you need to have atomic parameters, space groups and a unit cell. Space groups and unit cells are published for most data in the PDF. Atomic coordinates are published by contract agreement. The ICDD includes LPF, ICDD, and NIST atomic coordinates, but does not have access to CSD and ICSD atomic coordinates. Cross references are provided for users that have access to these databases. Data Sources for the PDF Coordinates in Source of Datathe PDF-4Reference* LPF Yes, All Data Yes ICSD No Yes CSD No Yes ICDD Select Grants Yes NIST Majority Yes * All references contain both a reference to the single crystal source data (ICSD, CSD, LPF) and a primary literature reference. PDF-4+ contains over 107,000 entries with atomic coordinate sets.
Finding Entries with Atomic Coordinates Go to the main Search page Click Search on the toolbar Click on the Structure tab Use the “Has Atomic Coordinates” search This search can be combined with any other search.
Finding Entries with Atomic Coordinates A search of zeolites having atomic coordinates finds 436 entries.
Molecular GraphicsFrom an Entry From the previous search we selected Zeolite A, PDF 04-010-2030. The tool bar at the top of the entry contains several graphics options. Selecting results in the molecular graphic menus.
Display Optionsthumbnails – in the product, double click for full scale The Display options include: 1) unit cell – top row left 2) 2D cell projections – top row 3) atomic environments – middle and bottom row
Molecular Display Right Click your mouse for the display window showing display options
Rotate x, y or z Zeolite A – Different viewing options Change atom colors Replace atom labels with Wyckoff labels and color codes
Export and Import This rotating display was made by exporting molecular graphics, taken at various rotation angles (shown in the previous slides), and importing the data into Adobe® Photoshop®.
Distributor Software ICDD works with software distributors of many of the worlds’ molecular graphics programs to provide enhanced molecular displays. The distributors work with data tables of atomic coordinates, unit cell parameters, temperature factors, space groups and symmetry operators contained within the PDF-4 so that data are automatically entered into their molecular display programs. The ICDD also works with many software developers and instrument manufacturers who produce molecular refinement programs (i.e., Rietveld Analyses). These programs export atomic coordinates for both refinement and molecular display. In general, these programs offer tremendous convenience and speed since the user does not have to provide export/import.
How to Export – xml Files Data are saved as an xml file, readable by web browsers
xml Files In the xml “card” format, all data are exported. This includes formula, nomenclature, atomic coordinates, anisotropic temperature factors, references, comments, etc., as shown in the boxes on the left. It also displays a fully indexed diffraction pattern (not shown).
How to Export – CIF, JPG, CSV Files Same Zeolite A entry displayed on earlier slides. Go to the Toolbar Click on Diffraction Pattern
How to Export – CIF, JPG, CSV Files The program will calculate and display a digital diffraction pattern. This pattern with atomic parameters and unit cell data can be saved to an export file. In this example, we are exporting the data in a CIF (2 theta, I) format. The CIF format is used by a wide variety of software programs.
Export/Import The next three slides are meant to demonstrate how PDF-4+ data can be imported into common molecular visualization programs. The programs selected are the proprietary software products of ICDD’s database partners. Examples are shown to display a few select capabilities, each program has a large number of display options. PartnerProgram Cambridge Crystallographic Data Centre (CCDC) Mercury Fachinformationszentrum Karlsruhe (FIZ) Visualize Materials Phases Pearson’s Crystal Data Data System
Importing CIF FilesPDF-4+ data file imported into Mercury. Mercury is a freeware program produced by the CCDC, and used with the CSD. http://www.ccdc.cam.ac.uk/products/mercury Wireframe Packing Multiple Unit Cells Ball and Stick Zeolite A
Importing CIF filesPDF-4+ data file imported into Visualize. Visualize is a program produced by FIZ/NIST for the ICSD. Space Fill Model VRML Model Zeolite A
Same Structure Viewed withPearson’s Crystal Data Molecular Visualization SoftwareNote: This uses the PDF-4+ cross reference. Wireframe All Wire Space Filling
Editing and Molecular Visualization Historically, many databases have faced issues displaying molecular structures. The primary issue has been the lack of uniform conventions and the back-application of recent conventions to historic data. ICDD Editors: Standardize all unit cell settings Convert non-standard space groups Check and test that the appropriate temperature factors are applied from the literature Analyze for correct bond angles and distance Check for non-positive temperature factors Ensure that the physical properties match the stated chemistry and crystallography Apply a quality evaluation system to all entries, including historic data, and publish the results in the comment sections of each entry.
Thank you for viewing our tutorial. Additional tutorials are available at the ICDD website (www.icdd.com). International Centre for Diffraction Data 12 Campus Boulevard Newtown Square, PA 19073 Phone: 610.325.9814 Fax: 610.325.9823