Download
1 / 27
270 likes | 397 Vues
Implementing Ecosystem Services Within Policy Settings. Suzie Greenhalgh Royal Society Workshop 9 August, 2011. Biodiversity, ES & Well-being. Ecosystem Services Today.

E N D
Implementing Ecosystem Services Within Policy Settings Suzie Greenhalgh Royal Society Workshop 9 August, 2011
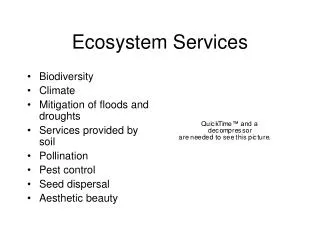
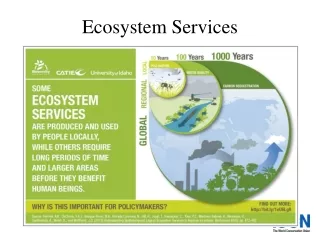
Ecosystem Services Today • Thinking in silos can lead to policy development & decisions that improves degraded ES BUT inadvertently damages other services • Post-MEA focus seems to be around • Valuing ecosystem services • Creating markets for ecosystem services • However, the real value of ES is thinking more holistically about our decisions
What Ecosystem Services Offers Decision-making? • ES can facilitate integrated & holistic policy development • It provides a consistent set of ES to consider in decision-making • More structured framework than considering broad environmental, social, cultural & economic impacts
Incorporating ES into Decisions 1. Frame the link between development & ES 2. Assess risks & opportunities 3. Explore future trends 4. Choose policy, planning & reporting approaches to sustain ES Identify the ES in play Screen the ES for relevance Assess the need for an economic valuation of services Assess the condition & trends of the relevant ES Identify ES risks & opportunities
NZ examples of ES into Policy • DOC: Exploring how to link human well-being to ES to biodiversity • Regional Council draft policy statements • NRC: What we want to achieve for biod & ecosystems To recognize the true worth & public benefits arising from biodiversity values & ES to Northland’s social & economic well-being. • WRC: Decline in state of resources impacts ES • Objective on ES The range of ES associated with natural resources are recognized & maintained or enhanced to enable on-going contribution to regional well-being.
Business engagement in ES • Strengthen corporate strategy • Mondi (international paper & packaging group) • Reduce risk of reputation & supply disruptions • Yves Rocher (global cosmetics firm) • Strengthen corporate decision-making processes • Eskom (South African power company) • ERM Ltd (global environmental consultancy) • AkzoNobel (paints and coatings company) • Identify new products & services • Syngenta (global agri-business group)
Corporate Ecosystem Services Review 3. Analyze trends in priority services 4. Identify business risks & opportunities 2. Identify priority ecosystem services 5. Develop strategies 1. Select the scope Identify & evaluate business risks & opportunities that might arise due to the trends in these priority ecosystem services Research & evaluate conditions & trends in the priority ecosystem services, & drivers of these trends Choose boundary within which to conduct ESR Systematically evaluate the degree of a company’s dependence & impact on 20+ ecosystem services • Outline strategies for minimizing risks & maximizing opportunities through internal changes, sector or stakeholder engagement, policy-maker engagement
ES, Modelling & Policy • Example: Assessing policy in Hurunui/Waiau catchments • Baseline: Current carbon price for all sectors already in ETS (ie. not agriculture) • Current carbon price on all sectors • Higher carbon price on all sectors • Nutrient cap • Nutrient cap with current carbon price on all sectors • Nutrient cap with higher carbon price on all sectors
Net Catchment Revenue Impacts (% change in farm income) • All regulation reduces farm income • Nutrient cap has smaller impact than current ETS carbon price
Catchment-level GHG Impacts(% change in GHG emissions) • Nutrient cap & ETS reduce GHG emissions • Nutrient cap reduces total GHG emissions more than current ETS carbon price • Nutrient cap reduces net GHG emissions more than both ETS carbon prices
Nutrient Impacts (% change in N) • ETS has a relatively small impact on nitrogen losses
Policy implications of Modelling • Highlights benefits of looking more ES • Water quality policy alone can result in significant reduction in GHG emissions • GHG policy alone not as effective at reducing nutrient losses • Maybe more than “one way to skin a cat” • Given controversy over capping agricultural GHG emissions, a water quality policy may give you the desired reductions in GHGs • Still not sufficient as more ES need to be considered to understand true impact of a decision/policy
A Research Snapshot • Tools & frameworks • Development of ES decision-making framework • Economic modelling that incorporates multiple ES • Policy reference guide • Framework for choosing between policy instruments • Implementation • Incorporating ES in regional policy • Integrating ES thinking with resource consents • Ecosystem Services Review for business
Implementing Ecosystem Services Within Policy SettingsKey Contacts: General: greenhalghs@landcareresearch.co.nz daigneaulta@landcareresearch.co.nz Business: Stancuc@landcareresearch.co.nz
Application to Hurunui Catchment • Growing concern over water use & environmental flows in North Canterbury • Proposed Hurunui Water Project (HWP) would nearly double area of land that can be irrigated (22 to 42 THA): • Opponents of HWP contest that additional irrigation would harm local ecosystem & impact river-based recreation opportunities • Regional Council also considering nutrient loading constraints in same catchment as HWP • Also need to consider implications of covering agriculture under NZ Emissions Trading Scheme in 2015
ES, Modelling & Policy 2 • Example: Increased irrigation in Hurunui catchment • Baseline irrigation with no carbon price • Baseline irrigation with carbon price • Hurunui Water Project with no carbon price • Hurunui Water Project with carbon price • Hurunui Water Project with nutrient cap but no carbon price
Baseline Results • Nearly all irrigation in high-production plains area • Sheep and beef dominant enterprise in Hurunui, with dairy and pine plantations in plains • Net GHGs lower because of sequestration in native vegetation on scrub and DOC land
Net Catchment Revenue Impacts • Implementing irrigation scheme increases revenue relative to baseline • Adding carbon price reduces revenue for all scenarios as farmers ‘taxed’ for GHG intensive production • Capping N and P at baseline levels with irrigation scheme still results in economic gains
Change in Aggregate Enterprise Area • Implementing irrigation scheme shifts forest and scrub to dairy and arable land • Aggregate area of Sheep and beef change minimal, but shift does occur from dryland to irrigated • Adding carbon price promotes expansion of forests as receive payments for carbon sequestration • Arable crops still viable option for irrigation scheme with carbon price as less GHG intensive
Catchment-level GHG Impacts • Implementing irrigation scheme increases emissions by 19-64% from increased intensity and deforestation • Adding carbon price reduces emissions below baseline for all scenarios • Capping N and P at baseline levels results in net GHG emissions as landowners increase area of pine plantations
Breakout of GHGs (tons CO2e) • Proportion of emissions roughly match latest national GHG inventory figures • Annual forest carbon sequestration in baseline is all from native vegetation as model assumes same proportion of pine cut per annum is re-planted • Additional forest sequestration in policy scenarios is from new pine or less conversion of scrub to pasture
Nutrient Impacts • Implementing irrigation scheme increases N by 19% and P by 3% from more intensive land use • Adding carbon price reduces nutrient loadings, but need close to $40/tCo2e to get near baseline levels for increased irrigation scenarios
Summary • NZ-FARM can estimate economic & some ES impacts from various policy & land mgt decisions • Hurunui results demonstrates importance of acknowledging trade-offs • may not be a ‘win-win’ situation when considering expansion of irrigation along with improvement/preservation of environmental quality • Model currently tracks water use, nutrients & GHGs but more ES could be added • Considering adding qualitative aspects to model results/discussion to at least indicate likely directional change of other ES
NZ-FARM – Key Components • Land-use/enterprises: • Pastoral: dairy, sheep, beef, deer, pigs • Arable: wheat, barley, maize • Horticultural: potatoes, grapes, berryfruit • Forestry: pine, eucalyptus, native • Other: scrub and Dept of Conservation land • Environmental outputs: • Nutrients: Nitrogen and Phosphorous • Water use • GHGs for farm and forest activities • Exploring water yield, sediments & pollination • Endogenous farm practices: • Change enterprise or land use • Adjust fertilizer and stocking rates • Add dairy feed pad or apply DCDs • Enter forest carbon sequestration programme
Aligned Activities:Policy Choice Framework • Freshwater Values, Monitoring & Outcomes Programme • To determine appropriate policy response(s) to an issue • 3 stages: Stage 1: Primary instrument selection • Clarify cost/benefit justification for govt intervention Stage 2: Land holder impacts • Landholder responses to policy instrument & its design Stage 3: Organisational responses • Impact on the organisation implementing proposed policies & what this means for achieving the policy objective.