Download
1 / 21
210 likes | 350 Vues
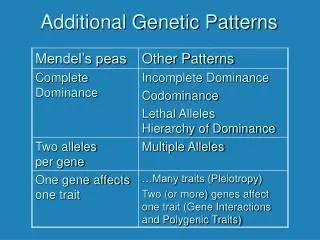
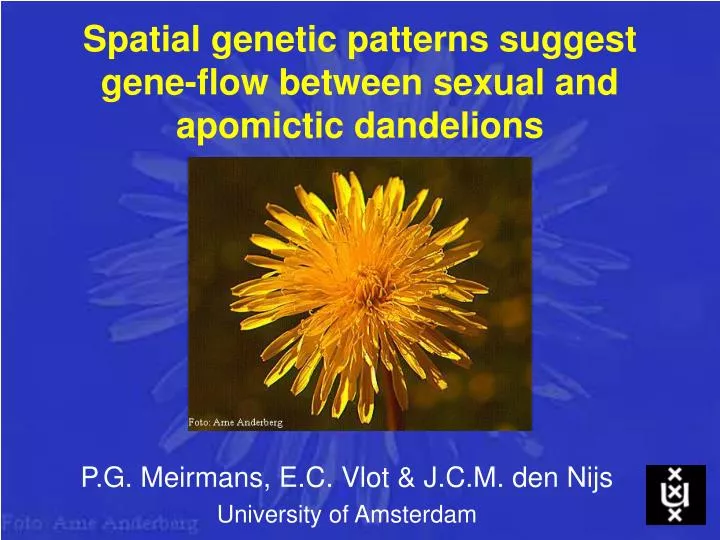
Spatial genetic patterns suggest gene-flow between sexual and apomictic dandelions. P.G. Meirmans, E.C. Vlot & J.C.M. den Nijs University of Amsterdam. Dandelions ( Taraxacum sect. Ruderalia ). Two ploidy levels: diploids (2n=16) and triploids (2n=24)

E N D
Spatial genetic patterns suggest gene-flow between sexual and apomictic dandelions P.G. Meirmans, E.C. Vlot & J.C.M. den Nijs University of Amsterdam
Dandelions(Taraxacum sect. Ruderalia) • Two ploidy levels: diploids (2n=16) and triploids (2n=24) • Diploids are sexual, triploids are asexual (apomixis) • Both cytotypes can coexist in mixed populations
Dandelions(Taraxacum sect. Ruderalia) • Allele frequencies same in diploids and triploids • More differentiation between populations than between diploids and triploids from the same population • Gene flow??
Question: • Is there a within-population genetic structure? • If so, what are the within population relationships between diploids and triploids? • evidence for gene-flow?
Spatial population structure in dandelions • When triploids are strictly apomictic, the spatial population structures in both ploidy levels should be independent. Expectation:
Sample population • Located in the Odenwald (Germany) ~280 m.a.s.l. • Practical work done in 1986 by L.C. Vlot • Spatial data analysis done in 2000
Four 'subpopulations' A, B, C & D, were designated A D C B y-coordinate (m) x-coordinate (m) Genetic analysis A total of 361 plants were sampled, coordinates were measured and ploidy levels checked Allozyme analysis was performed for three loci: 6PGD-1, 6PGD-2, MDH-1
Coefficient of Kinship • Estimates kinship between two individuals relative to allele frequencies (Loiselle et al. 1995, Am. J. Bot.) • Used as an autocorrelation coefficient
diploids triploids Kinship correlogram over all three loci Average kinship as a function of distance between individuals 0.08 0.04 average rij 0.00 0.04 0.25 0.5 1 2 4 8 16 32 64 128 Distance (m) black symbols indicate significance p<0.01
Kinship test kinship matrix spatial distance matrix 1 2 3 4 5 6 1 2 3 4 5 6 1 x d d d d d 1 x d d d d d 2 x d d d d 2 x d d d d 3 x d d d 3 x d d d 4 x d d 4 x d d 5 x d 5 x d 6 x 6 x average kinship coefficient significance test by permutation
Kinship test kinship matrix spatial distance matrix 2 2 2 3 3 3 2 2 2 3 3 3 2 x d d d d d 2 x d d d d d 2 x d d d d 2 x d d d d 2 x d d d 2 x d d d 3 x d d 3 x d d 3 x d 3 x d 3 x 3 x average kinship coefficient significance test by permutation
Kinship test kinship matrix spatial distance matrix 2 2 2 3 3 3 2 2 2 3 3 3 2 d d d 2 d d d 2 d d d 2 d d d 2 d d d 2 d d d 3 3 3 3 3 3 average kinship coefficient significance test by permutation
Kinship calculated between ploidy levels Average kinship as a function of distance between individuals 0.08 0.04 average rij 0.00 0.04 0.25 0.5 1 2 4 8 16 32 64 128 Distance (m) black symbols indicate significance p<0.01
So... • There is a genetic structure within the population • Congruence in spatial genetic patterns between diploids and triploids
Sex or selection? Two explanations for congruence in spatial genetic patterns for diploids and triploids: SEX: gene-flow from triploids to diploids and/or vice versa -BUT: triploids are apomicts, most triploid pollen is sterile SELECTION: selection on allozyme loci or on linked genes -BUT: covariation between loci, same selection works on multiple loci.
New sample y-coordinate (m) x-coordinate (m) • revisited Odenwald population • sampled 360 plants, continuously distributed (yellow area) • vegetation analysis around every plant (circle, 25 cm radius) • genetic analysis using allozymes, microsatellites and chloroplast RFLP's
Preliminary results Mantel tests for association between cp-haplotype, vegetation and spatial distance matrix A matrix B corrected for Mantel’s r p-value cp-haplotype space - 0.031 0.10 cp-haplotype veget. - 0.052 0.04 cp-haplotype veget. space 0.048 0.04
Mantel correlogram for chloroplasts Likeness in cp-haplotype as a function of distance between individuals Mantel's r Distance (m) black symbols indicate significance p<0.05 after Bonferroni correction
So... • Spatial pattern present in distribution of chloroplast haplotypes • Indication of limited seed-flow?