Download
1 / 65
650 likes | 760 Vues
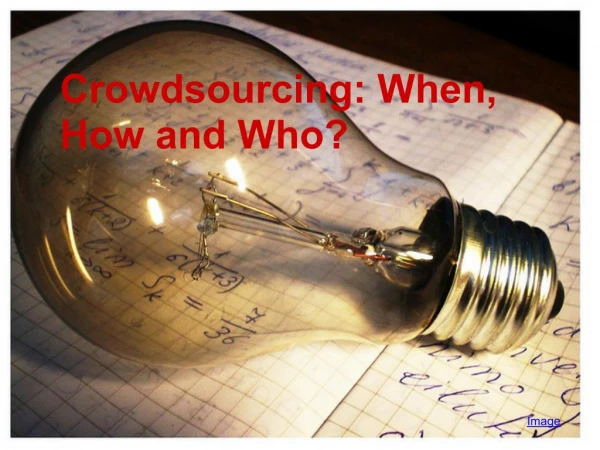
Crowdsourcing using Mechanical Turk: Quality Management and Scalability. Panos Ipeirotis Stern School of Business New York University. Twitter: @ ipeirotis “A Computer Scientist in a Business School” http://behind-the-enemy-lines.com.

E N D
Crowdsourcing using Mechanical Turk: Quality Management and Scalability PanosIpeirotis Stern School of Business New York University Twitter: @ipeirotis “A Computer Scientist in a Business School”http://behind-the-enemy-lines.com Joint work with: Jing Wang, Foster Provost, Josh Attenberg, and Victor Sheng; Special thanks to AdSafe Media
Brand advertising not embraced Internet advertising yet… Afraid of improper brand placement
Model needed within days • Pharmaceutical firm does not want ads to appear: • In pages that discuss swine flu (FDA prohibited pharmaceutical company to display drug ad in pages about swine flu) • Big fast-food chain does not want ads to appear: • In pages that discuss the brand (99% negative sentiment) • In pages discussing obesity, diabetes, cholesterol, etc • Airline company does not want ads to appear: • In pages with crashes, accidents, … • In pages with discussions of terrorist plots against airlines
Need to build models fast Traditionally, modeling teams have invested substantial internal resources in data collection, extraction, cleaning, and other preprocessing No time for such things… However, now, we can outsource preprocessing tasks, such as labeling, feature extraction, verifying information extraction, etc. using Mechanical Turk, oDesk, etc. quality may be lower than expert labeling (much?) but low costs can allow massive scale 7
Example: Build an “Adult Web Site” Classifier • Need a large number of hand-labeled sites • Get people to look at sites and classify them as: G (general audience)PG (parental guidance) R(restricted)X (porn) • Cost/Speed Statistics • Undergrad intern: 200 websites/hr, cost: $15/hr • Mechanical Turk: 2500 websites/hr, cost: $12/hr
Bad news: Spammers! • Worker ATAMRO447HWJQ • labeled X (porn) sites as G (general audience)
Redundant votes, infer quality Look at our spammer friend ATAMRO447HWJQ together with other 9 workers • Using redundancy, we can compute error rates for each worker
Algorithm of (Dawid & Skene, 1979) [and many recent variations on the same theme] Iterative process to estimate worker error rates Initialize“correct” label for each object (e.g., use majority vote) Estimate error rates for workers (using “correct” labels) Estimate “correct” labels (using error rates, weight worker votes according to quality) Go to Step 2 and iterate until convergence Error rates for ATAMRO447HWJQ P[G→ G]=99.947% P[G → X]=0.053% P[X→ G]=99.153% P[X → X]=0.847% Our friend ATAMRO447HWJQmarked almost all sites as G.Seems like a spammer…
Challenge: From Confusion Matrixes to Quality Scores • Confusion Matrix for ATAMRO447HWJQ • P[X → X]=0.847% P[X → G]=99.153% • P[G → X]=0.053% P[G → G]=99.947% How to check if a worker is a spammer using the confusion matrix? (hint: error rate not enough)
Challenge 1: Spammers are lazy and smart! • Confusion matrix for spammer • P[X → X]=0% P[X → G]=100% • P[G → X]=0% P[G → G]=100% • Confusion matrix for good worker • P[X → X]=80% P[X → G]=20% • P[G → X]=20% P[G → G]=80% • Spammers figure out how to fly under the radar… • In reality, we have 85% G sites and 15% X sites • Error rate of spammer = 0% * 85% + 100% * 15% = 15% • Error rate of good worker = 85% * 20% + 85% * 20% = 20% False negatives: Spam workers pass as legitimate
Challenge 2: Humans are biased! • Error rates for CEO of AdSafe • P[G → G]=20.0% P[G → P]=80.0% P[G → R]=0.0% P[G → X]=0.0% • P[P → G]=0.0% P[P → P]=0.0%P[P → R]=100.0% P[P → X]=0.0% • P[R → G]=0.0% P[R → P]=0.0% P[R → R]=100.0% P[R → X]=0.0% • P[X → G]=0.0% P[X → P]=0.0% P[X → R]=0.0% P[X → X]=100.0% • We have 85% G sites, 5% P sites, 5% R sites, 5% X sites • Error rate of spammer (all G) = 0% * 85% + 100% * 15% = 15% • Error rate of biased worker = 80% * 85% + 100% * 5% = 73% • False positives: Legitimate workers appear to be spammers • (important note: bias is not just a matter of “ordered” classes)
Solution: Reverse errors first, compute error rate afterwards • Error Rates for CEO of AdSafe • P[G → G]=20.0% P[G → P]=80.0% P[G → R]=0.0% P[G → X]=0.0% • P[P → G]=0.0% P[P → P]=0.0%P[P → R]=100.0% P[P → X]=0.0% • P[R → G]=0.0% P[R → P]=0.0% P[R → R]=100.0% P[R → X]=0.0% • P[X → G]=0.0% P[X → P]=0.0% P[X → R]=0.0% P[X → X]=100.0% • When biased worker says G, it is 100% G • When biased worker says P, it is 100% G • When biased worker says R, it is 50% P, 50% R • When biased worker says X, it is 100% X Small ambiguity for “R-rated” votes but other than that, fine!
Solution: Reverse errors first, compute error rate afterwards • Error Rates for spammer: ATAMRO447HWJQ • P[G → G]=100.0%P[G → P]=0.0% P[G → R]=0.0% P[G → X]=0.0% • P[P → G]=100.0% P[P → P]=0.0% P[P → R]=0.0% P[P → X]=0.0% • P[R → G]=100.0% P[R → P]=0.0% P[R → R]=0.0% P[R → X]=0.0% • P[X → G]=100.0% P[X → P]=0.0% P[X → R]=0.0% P[X → X]=0.0% • When spammer says G, it is 25% G, 25% P, 25% R, 25% X • When spammer says P, it is 25% G, 25% P, 25% R, 25% X • When spammer says R, it is 25% G, 25% P, 25% R, 25% X • When spammer says X, it is 25% G, 25% P, 25% R, 25% X [note: assume equal priors] The results are highly ambiguous. No information provided!
Expected Misclassification Cost • High cost: probability spread across classes • Low cost: “probability massconcentrated in one class [***Assume misclassification cost equal to 1, solution generalizes]
Quality Score Quality Score: A scalar measure of quality • A spammer is a worker who always assigns labels randomly, regardless of what the true class is. • Scalar score, useful for the purpose of ranking workers HCOMP 2010
Instead of blocking: Quality-sensitive Payment • Threshold-ing rewards gives wrong incentives: • Good workers have no incentive to give full quality (need to just be above threshold for payment), • Decent, but useful, workers get fired • Instead: estimate payment level based on quality • Pay full price for workers with quality above specs • Estimate reduced payment based on how many workers with given confusion matrix I need to reach specs
Too much theory? Open source implementation available at: http://code.google.com/p/get-another-label/ • Input: • Labels from Mechanical Turk • [Optional] Some “gold” labels from trusted labelers • Cost of incorrect classifications (e.g., XG costlier than GX) • Output: • Corrected labels • Worker error rates • Ranking of workers according to their quality • [Coming soon] Quality-sensitive payment • [Coming soon] Risk-adjusted quality-sensitive payment
Example: Build an “Adult Web Site” Classifier • Get people to look at sites and classify them as: G (general audience)PG (parental guidance) R(restricted)X (porn) But we are not going to label the whole Internet… • Expensive • Slow
Quality and Classification Performance Noisy labels lead to degraded task performance Labeling quality increases classification quality increases Quality = 100% Quality = 80% Quality = 60% Quality = 50% Single-labeler quality (probability of assigning correctly a binary label)
Tradeoffs: More data or better data? Get more examples Improve classification Get more labels Improve label quality Improve classification Quality = 100% Quality = 80 % Quality = 60% Quality = 50% KDD 2008, Best paper runner-up 23
(Very) Basic Results We want to follow the direction that has the highest “learning gradient” • Estimate improvement with more data (cross-validation) • Estimate sensitivity to data quality (introduce noise) Rule-of-thumb results: With high quality labelers (85% and above): Get more data (One worker per example) With low quality labelers (~60-70%):Improve quality (Multiple workers per example)
Selective Repeated-Labeling • We do not need to label everything the same way • Key observation: we have additional information to guide selection of data for repeated labeling • the current multiset of labels • the current model built from the data • Example: {+,-,+,-,-,+} vs. {+,+,+,+,+,+} • Will skip details in the talk, see “Repeated Labeling” paper
Improving worker participation • With just labeling, workers are passively labeling the data that we give them • Why not asking them to search themselves and find training data
Guided Learning Ask workers to find example web pages (great for “sparse” content) After collecting enough examples, easy to build and test web page classifier http://url-collector.appspot.com/allTopics.jsp KDD 2009
Limits of Guided Learning No incentives for workers to find “new” content After a while, submitted web pages similar to already submitted ones No improvement for classifier 28
The result? Blissful ignorance… Classifier seems great: Cross-validation tests show excellent performance Alas, classifier fails: The “unknown unknowns” ™ No similar training data in training set “Unknown unknowns” = classifier fails with high confidence 29
Beat the Machine! Ask humans to find URLs that the classifier will classify incorrectly another human will classify correctly http://adsafe-beatthemachine.appspot.com/ Example: Find hate speech pages that the machine will classify as benign 30
Probes Successes Error rate for probes significantly higher than error rate on (stratified) random data (10x to 100x higher than base error rate)
Structure of Successful Probes Now, we identify errors much faster (and proactively) Errors not random outliers: We can “learn” the errors Could not, however, incorporate errors into existing classifier without degrading performance 32
Unknown unknowns Known unknowns Once humans find the holes, they keep probing (e.g., multilingual porn ) However, we can learn what we do not know (“unknown unknowns” “known unknowns”) We now know the areas where we are likely to be wrong 33
Reward Structure for Humans High reward higher when: Classifier confident (but wrong) and We do notknow it will be an error Medium reward when: Classifier confident (but wrong) and We do know it will be an error Low reward when: Classifier already uncertain about outcome 34
Current Directions Learn how to best incorporate knowledge to improve classifier Measure prevalence of newly identified errors on the web (“query by document”) Increase rewards for errors prevalent in the “generalized” case 35
Workers reacting to bad rewards/scores Score-based feedback leads to strange interactions: The “angry, has-been-burnt-too-many-times” worker: • “F*** YOU! I am doing everything correctly and you know it! Stop trying to reject me with your stupid ‘scores’!” The overachiever worker: • “What am I doing wrong?? My score is 92% and I want to have 100%”
An unexpected connection at theNAS “Frontiers of Science” conf. Your bad workers behave like my mice!
An unexpected connection at theNAS “Frontiers of Science” conf. Your bad workers behave like my mice! Eh?
An unexpected connection at theNAS “Frontiers of Science” conf. Your bad workerswant to engage their brain only for motor skills,not for cognitive skills Yeah, makes sense…
An unexpected connection at theNAS “Frontiers of Science” conf. And here is how I train mymice to behave…
An unexpected connection at theNAS “Frontiers of Science” conf. Confuse motor skills! Reward cognition! I should try this the moment that I get back to my room
Implicit Feedback using Frustration • Punishbad answers with frustration of motor skills (e.g., add delays between tasks) • “Loading image, please wait…” • “Image did not load, press here to reload” • “404 error. Return the HIT and accept again” • Rewardgood answers by rewarding the cognitive part of the brain (e.g, introduce variety/novelty, return results fast) →Make this probabilistic to keep feedback implicit
First result • Spammer workers quickly abandon • Good workers keep labeling • Bad: Spammer bots unaffected • How to frustrate a bot? • Give it a CAPTHCA
Second result (more impressive) • Remember, scheme was for training the mice… • 15% of the spammers start submitting good work! • Putting cognitive effort is more beneficial (?) • Key trick: Learn to test workers on-the-fly
+ + - - - - - - - - Why does Model Uncertainty (MU) work? + + + + - - - - - - - - + + + + + + + + + - - - - - - - - + + - - - - + + - - - - + + • MU score distributions for correctly labeled (blue) and incorrectly labeled (purple) cases