Download
1 / 1
40 likes | 272 Vues
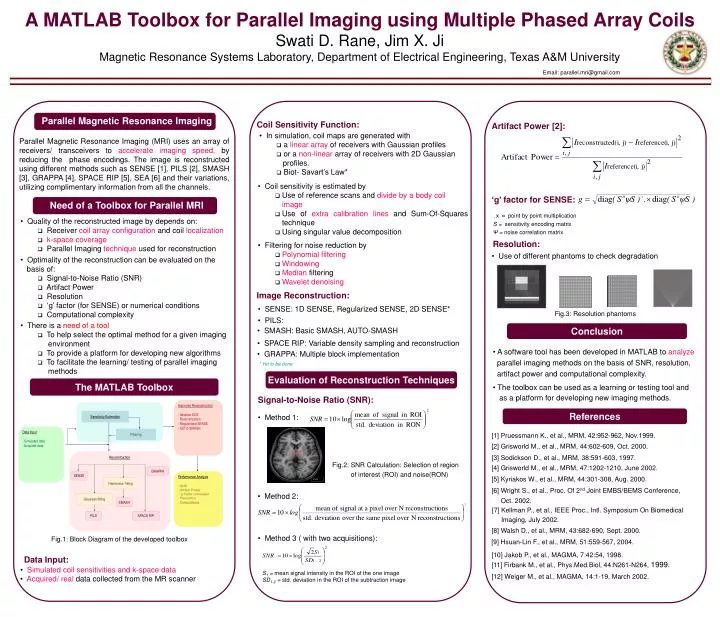
Improved Reconstruction Iterative SOS Reconstruction Regularized SENSE AUTO-SMASH. Sensitivity Estimation. Data Input - Simulated data Acquired data. Filtering. Reconstruction. GRAPPA. SENSE. Performance Analysis - SNR Artifact Power ‘g’ factor calculation - Resolution

E N D
Improved Reconstruction • Iterative SOS • Reconstruction • Regularized SENSE • AUTO-SMASH Sensitivity Estimation • Data Input • - Simulated data • Acquired data Filtering Reconstruction GRAPPA SENSE • Performance Analysis • - SNR • Artifact Power • ‘g’ factor calculation • - Resolution • Computations Harmonics- fitting Gaussian fitting SMASH PILS SPACE RIP A MATLAB Toolbox for Parallel Imaging using Multiple Phased Array Coils Swati D. Rane, Jim X. Ji Magnetic Resonance Systems Laboratory, Department of Electrical Engineering, Texas A&M University Email: parallel.mri@gmail.com Parallel Magnetic ResonanceImaging Coil Sensitivity Function: Artifact Power [2]: • In simulation, coil maps are generated with • a linear array of receivers with Gaussian profiles • or a non-linear array of receivers with 2D Gaussian profiles. • Biot- Savart’s Law* Parallel Magnetic Resonance Imaging (MRI) uses an array of receivers/ transceivers to accelerate imaging speed, by reducing the phase encodings. The image is reconstructed using different methods such as SENSE [1], PILS [2], SMASH [3], GRAPPA [4], SPACE RIP [5], SEA [6] and their variations, utilizing complimentary information from all the channels. • Coil sensitivity is estimated by • Use of reference scans and divide by a body coil image • Use of extra calibration lines and Sum-Of-Squares technique • Using singular value decomposition ‘g’ factor for SENSE: Need of a Toolbox for Parallel MRI .x = point by point multiplication S = sensitivity encoding matrix Ψ = noise correlation matrix • Quality of the reconstructed image by depends on: • Receiver coil array configuration and coil localization • k-space coverage • Parallel Imaging technique used for reconstruction Resolution: • Filtering for noise reduction by • Polynomial filtering • Windowing • Median filtering • Wavelet denoising • Use of different phantoms to check degradation • Optimality of the reconstruction can be evaluated on the • basis of: • Signal-to-Noise Ratio (SNR) • Artifact Power • Resolution • ‘g’ factor (for SENSE) or numerical conditions • Computational complexity Image Reconstruction: • SENSE: 1D SENSE, Regularized SENSE, 2D SENSE* • PILS: Fig.3: Resolution phantoms • SMASH: Basic SMASH, AUTO-SMASH • There is a need of a tool • To help select the optimal method for a given imaging environment • To provide a platform for developing new algorithms • To facilitate the learning/ testing of parallel imaging methods Conclusion • SPACE RIP: Variable density sampling and reconstruction • GRAPPA: Multiple block implementation • A software tool has been developed in MATLAB to analyze • parallel imaging methods on the basis of SNR, resolution, • artifact power and computational complexity. * Yet to be done Evaluation of Reconstruction Techniques The MATLAB Toolbox • The toolbox can be used as a learning or testing tool and • as a platform for developing new imaging methods. Signal-to-Noise Ratio (SNR): References • Method 1: [1] Pruessmann K., et al., MRM, 42:952-962, Nov.1999. [2] Grisworld M., et al., MRM, 44:602-609, Oct. 2000. ROI [3] Sodickson D., et al., MRM, 38:591-603, 1997. Fig.2: SNR Calculation: Selection of region of interest (ROI) and noise(RON) [4] Grisworld M., et al., MRM, 47:1202-1210, June 2002. [5] Kyriakos W., et al., MRM, 44:301-308, Aug. 2000. RON [6] Wright S., et al., Proc. Of 2nd Joint EMBS/BEMS Conference, Oct. 2002. • Method 2: [7] Kellman P., et al., IEEE Proc., Intl. Symposium On Biomedical Imaging, July 2002. [8] Walsh D., et al., MRM, 43:682-690, Sept. 2000. • Method 3 ( with two acquisitions): Fig.1: Block Diagram of the developed toolbox [9] Hsuan-Lin F., et al., MRM, 51:559-567, 2004. [10] Jakob P., et al., MAGMA, 7:42:54, 1998. Data Input: • Simulated coil sensitivities and k-space data • Acquired/ real data collected from the MR scanner [11] Firbank M., et al., Phys.Med.Biol, 44:N261-N264, 1999. S1 = mean signal intensity in the ROI of the one image SD1-2 = std. deviation in the ROI of the subtraction image [12] Weiger M., et al., MAGMA, 14:1-19, March 2002.