Download
1 / 25
280 likes | 565 Vues
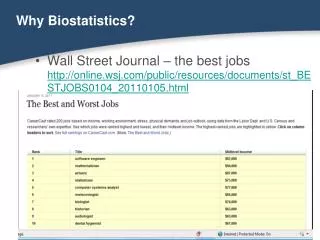
Introduction to Biostatistics (PubHlth 540) Lecture 1: Overview Ed Stanek. Acknowledgement: Thanks to Professor Balasubramanian and Professor Pagano for lecture material. Topics. Course Logistics Why Biostatistics? Course outline: Data Presentation Inference Prediction. Topics.

E N D
Introduction to Biostatistics(PubHlth 540) Lecture 1: OverviewEd Stanek Acknowledgement: Thanks to Professor Balasubramanian and Professor Pagano for lecture material
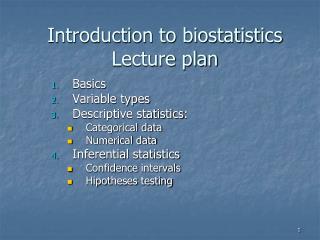
Topics • Course Logistics • Why Biostatistics? • Course outline: • Data Presentation • Inference • Prediction
Topics • Course Logistics • Why Biostatistics? • Course outline: • Data Presentation • Inference • Prediction
Course Logistics • Instructor: Ed Stanek • Office Hours: Tu/Th, 4:00 – 5:15 • Office: 401 Arnold • Email: stanek@schoolph.umass.edu Location:Morrill III Room 212
Course Logistics • Grading: • Homework (n=10 assignments+reports): 10% • Exam1: 30% • Exam2: 30% • Exam3: 30% • Final: 30% Best 2 of 3
Topics • Course Logistics • Why Biostatistics? • Course outline: • Data Presentation • Inference • Prediction
Biostatistics • “There are three kind of lies: lies, damn lies, and statistics” • Mark Twain (1835-1910) • Bio --- bios Greek --- life • Statistics Latin --- statisticum collegium (lecture about state affairs) A branchofappliedmathematicsconcernedwiththecollectionandinterpretationofquantitativedataandtheuseofprobabilitytheorytoestimatepopulationparameters -- www.hyperdictionary.com
Course Outline • Presentation • Inference • Prediction
Data presentation • Data presentation techniques enable us to condense large amounts of information into a digestable form • Examples: • Tables • Bar graphs • Histograms etc.
Eastern Europe & Central Asia 1.4 million [920 000 – 2.1 million] Western & Central Europe 610 000 [480 000 – 760 000] North America 1.0 million [540 000 – 1.6 million] East Asia 1.1 million [560 000 – 1.8 million] North Africa & Middle East 540 000 [230 000 – 1.5 million] Caribbean 440 000 [270 000 – 780 000] South & South-East Asia 7.1 million [4.4 – 10.6 million] Sub-Saharan Africa 25.4 million [23.4 – 28.4 million] Latin America 1.7 million [1.3 – 2.2 million] Oceania 35 000 [25 000 – 48 000] Total: 39.4 (35.9 – 44.3) million Data presentation - exampleAdults and children estimated to be living with HIV as of end 2004
Election 2004 Results http://www-personal.umich.edu/~mejn/election/
Course Outline • Presentation • Inference • Prediction
Inference But Do We Believe It? Inference Sample from a populationFromthe sample infer (guess)characteristics of the population.
Inference • Population: Entire group of interest • Sample: a small subset of population to be studied • Parameter: a summary measure or characteristic of a population (e.g. mean) • Statistic: summary measure or characteristic of a sample
Inference • Theory and methodology for generalizing from a sample to a population Population Sample drawn from population sample guess Inference regarding the population made from sample
Inference - example Mortality before and after the 2003 invasion of Iraq: cluster sample survey-- Lancet 2004; 364: 1857-64 “We estimate that there were 98000 extra deaths (95% CI 8000-194 000) during the post-war period in the 97% of Iraq represented by all the clusters except Falluja.”
Inference - example Meat Consumption and Risk of Colorectal Cancer –- JAMA293 (2) Jan. 12, 2005 “In our analyses, the association between colon cancer risk and high intake of red (RR, 1.41; 95% CI, 1.12–1.78) and processed meat (RR, 1.33; 95% CI, 1.08–1.64) measured at a single time point is consistent with meta-analysis results, 50 adjusting for age and energy intake. However, the association was substantially attenuated with further adjustment for educational attainment, cigarette smoking, physical activity, and other lifestyle factors associated with red meat intake.”
Course Outline • Presentation • Inference • Prediction
Prediction A diagnosis of diabetes can be suspected in the presence of the following signs and symptoms of hyperglycemia: • Polydipsia (increased thirst) • Polyuria (increased urinary frequency with increased volume) • Fatigue • Polyphagia (increased appetite) • Weight loss • Abnormal healing • Blurred vision • Increased occurrence of infections, particularly those caused by yeast.
Prediction • The risk of diabetes is increased in asymptomatic individuals if any of the following risk factors are present: • A strong family history of diabetes (parents or sibling) • Obesity (20% above ideal body weight) • Certain races (American Indian, Hispanic, African, or Pacific Islander ancestry) • Women with previous gestational diabetes or history of babies of 9 pounds (4Kg) or more at birth • Previously identified impaired glucose tolerance (IGT) • Hypertension or significant hypertriglyceridemia (> 250 mg/dL) • 40 years of age with any of the preceding factors.
Prediction Could you have diabetes and not know it? There are 18.2 million Americans with diabetes -- and nearly one-third of them (or 5.2 million people) do not know it! Take this test to see if you are at risk for having diabetes. Diabetes is more common in African Americans, Latinos, Native Americans, Asian Americans and Pacific Islanders. If you are a member of one of these ethnic groups, you need to pay special attention to this test. http://www.diabetes.org/diabetes-basics/prevention/diabetes-risk-test/ To find out if you are at risk, answer the following questions as they apply to you, then click the "CALCULATE" button to run the test and view your score. Please select your age category. 0-4445-6465 or Older Please select your height. Please enter your weight in pounds. I am a woman who has had a baby weighing more than nine pounds at birth.True or False
Prediction I have a sister or brother with diabetes.TrueFalse I have a parent with diabetes.TrueFalse I am under 65 years of age and I get little or no exercise.TrueFalse CALCULATE your score Read our Frequently Asked Questions regarding this Risk Test. The information contained in this American Diabetes Association (ADA) Web site is not a substitute for medical advice or treatment, and the ADA recommends consultation with your doctor or health care professional.
Summary • Website: • Syllabus • Lecture Notes • Homework Problems • Course Outline: • Data Presentation • Inference • Prediction